Fig. 16
Download original image
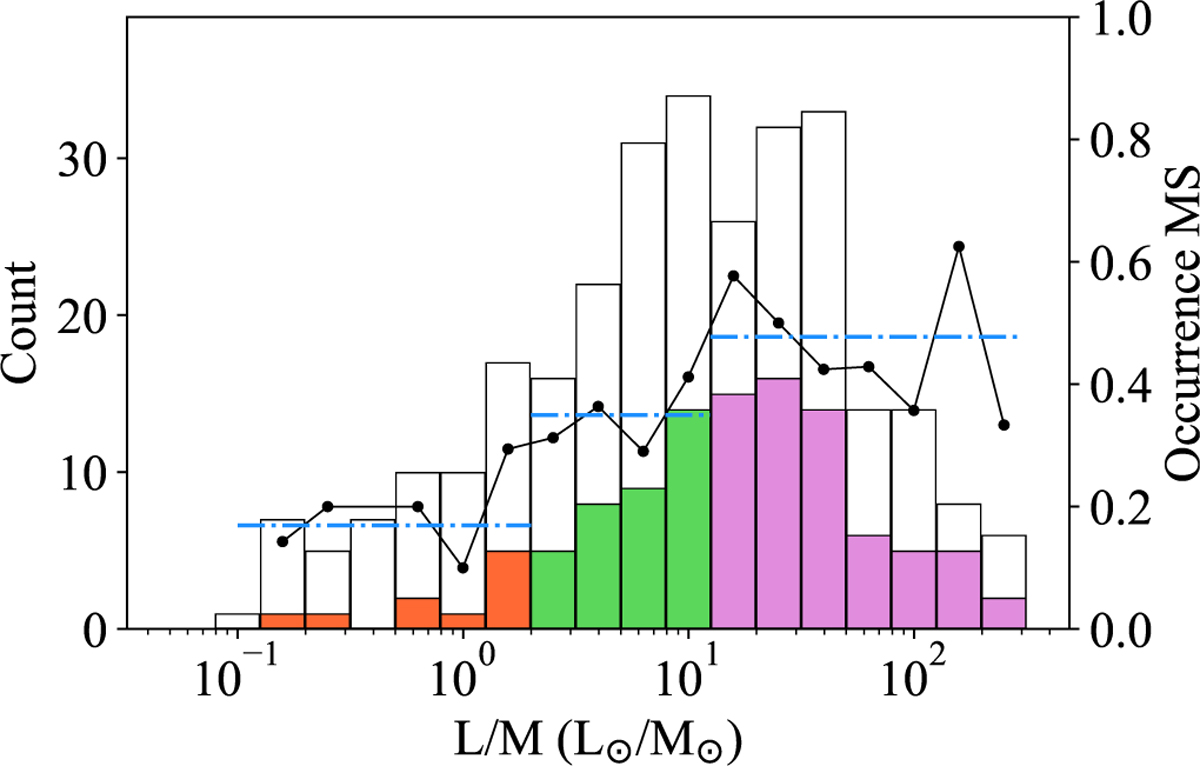
Distribution of the ALMAGAL clumps hosting at least 10 cores in different bins of the ratio L/M. The colored histograms show the systems were a signature of MS is found, with different colors referring to the different intervals of L/M ratio, i.e., orange L/M ≤ 2 L⊙/M⊙, green 2<L/M ≤ 10 L⊙/M⊙ and purple L/M>10 L⊙/M⊙. The solid black line, which refers to the right y-axis scale, indicate the relative fraction of systems with MS with respect to the observed ones in bins of L/M, while the dot-dashed line shows the average occurrence fraction of MS systems in the three intervals of L/M.
Current usage metrics show cumulative count of Article Views (full-text article views including HTML views, PDF and ePub downloads, according to the available data) and Abstracts Views on Vision4Press platform.
Data correspond to usage on the plateform after 2015. The current usage metrics is available 48-96 hours after online publication and is updated daily on week days.
Initial download of the metrics may take a while.