Fig. 17
Download original image
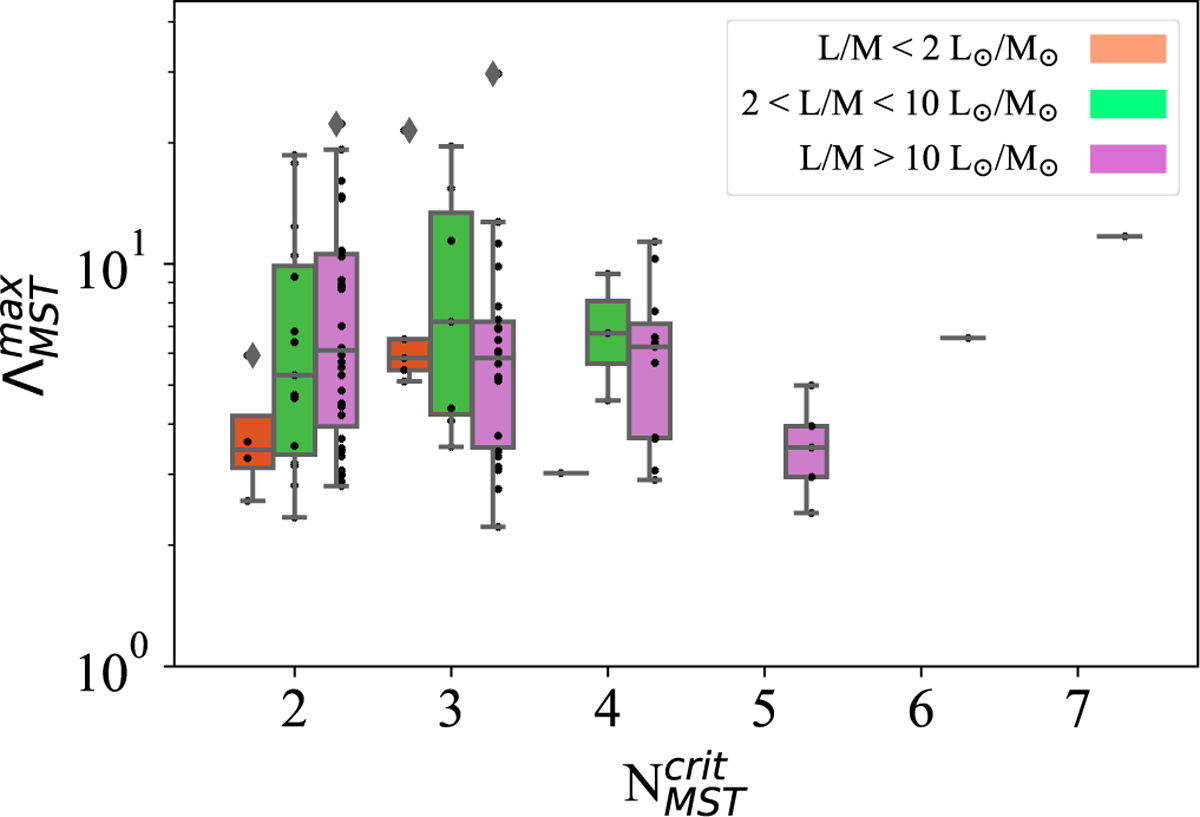
Boxplots showing the distribution of maximum value of the mass segregation ratio, ![]() , divided for the different values
, divided for the different values ![]() that identify the interval where the MSR profile is statistically higher than unity, in the 110 ALMAGAL clumps where signatures of MS are found. Those clumps are divided into three groups according to the L/M ratio composed of 59, 83, and 154 systems. The rectangular area of the boxplots shows the interquartile intervals, while the whiskers represent the 10th to 90th percentile intervals; the diamond symbols indicate the cases outside this interval.
that identify the interval where the MSR profile is statistically higher than unity, in the 110 ALMAGAL clumps where signatures of MS are found. Those clumps are divided into three groups according to the L/M ratio composed of 59, 83, and 154 systems. The rectangular area of the boxplots shows the interquartile intervals, while the whiskers represent the 10th to 90th percentile intervals; the diamond symbols indicate the cases outside this interval.
Current usage metrics show cumulative count of Article Views (full-text article views including HTML views, PDF and ePub downloads, according to the available data) and Abstracts Views on Vision4Press platform.
Data correspond to usage on the plateform after 2015. The current usage metrics is available 48-96 hours after online publication and is updated daily on week days.
Initial download of the metrics may take a while.