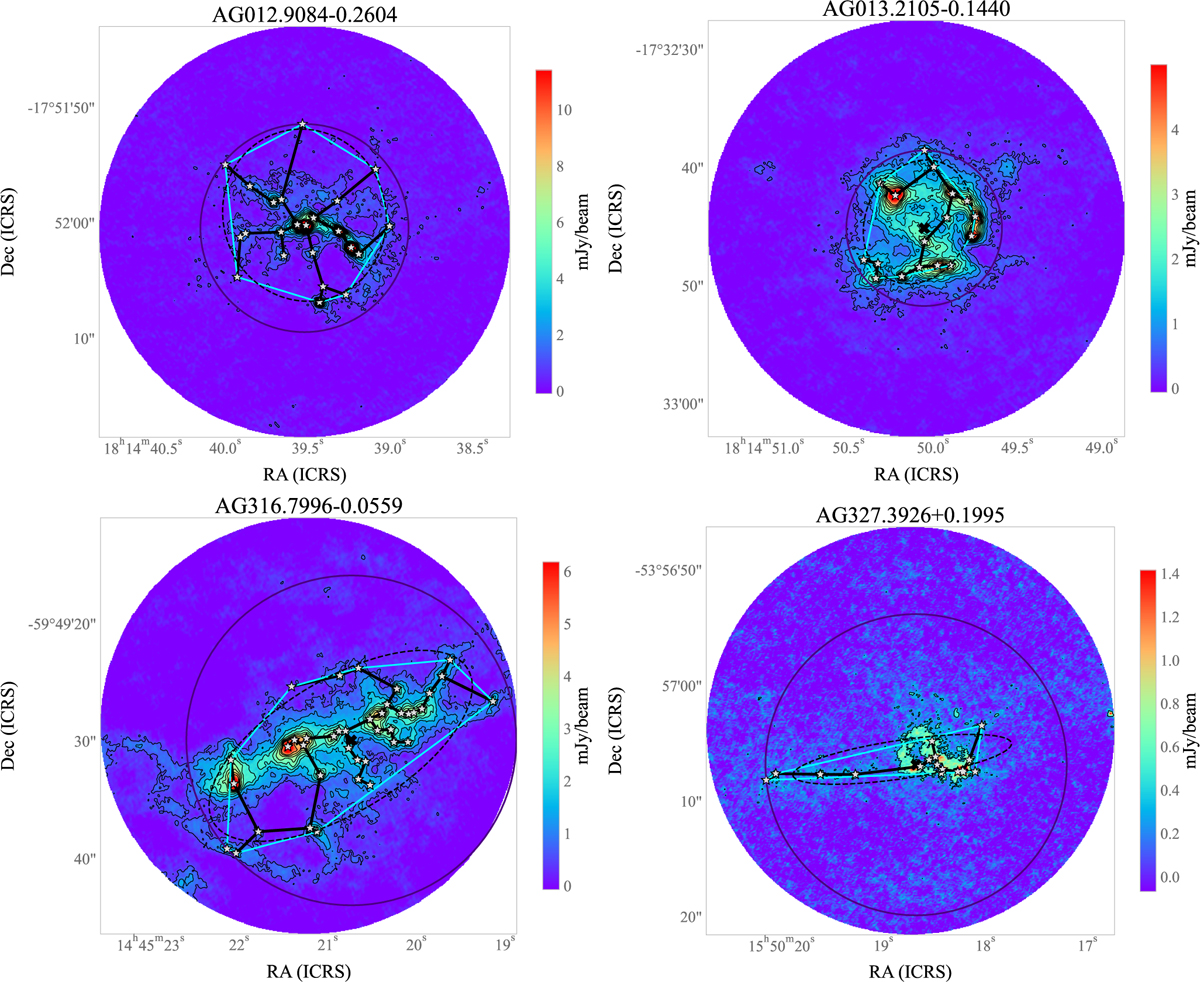
Fig. 2
Download original image
Examples of the distribution of cores found in four ALMAGAL clumps overlapping on the dust continuum map at 1.4 mm from which they were extracted. These fields show examples of clustered systems with circular and elliptical patterns and cases of aligned cores. The contour levels correspond to 4n × σ level and σ equal to the noise level measured on the image. The positions of the cores from the ALMAGAL catalog extracted by Coletta et al. (2025) are shown with gray star markers. In each field we indicate the cluster geometrical center and its radius (see the definition in the text) with a black cross and a dark blue circle, respectively. We also show the convex hull polygon (cyan segments) and the corresponding best-fitting ellipse (black dashed line) adopted for the morphological characterization of the system. The solid thick black segments are the MST edges determined with Prim’s algorithm (Prim 1957), connecting all the cores in the field.
Current usage metrics show cumulative count of Article Views (full-text article views including HTML views, PDF and ePub downloads, according to the available data) and Abstracts Views on Vision4Press platform.
Data correspond to usage on the plateform after 2015. The current usage metrics is available 48-96 hours after online publication and is updated daily on week days.
Initial download of the metrics may take a while.