Fig. C.2
Download original image
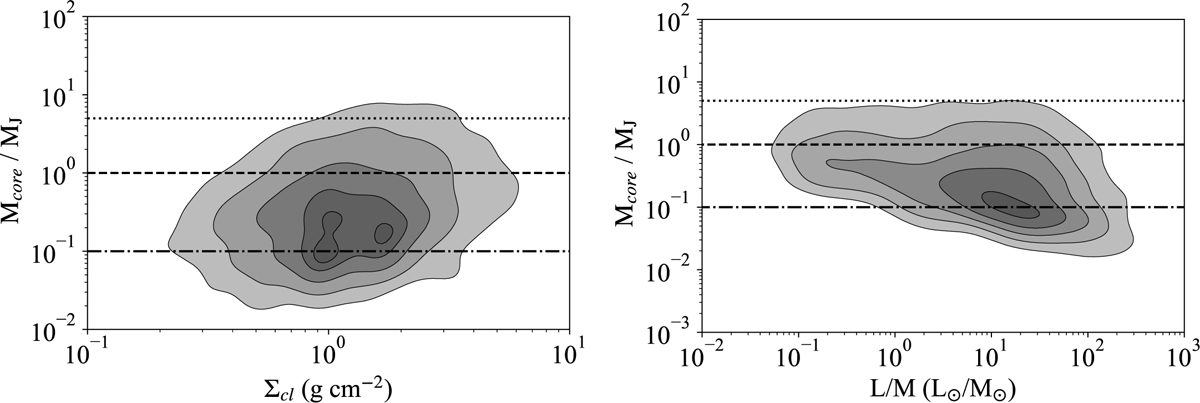
Density distribution plot of the core mass normalized to the thermal Jeans mass, MJ, presented as function of the clump L/M (right panel) and surface density, Σc (left panel). The contours identify the different areas for which, going from the external to the internal, a fraction of 10%, 25%, 50%, 75%, 95% of the entire distribution lies outside. The horizontal lines are reference values of the ratios: unity (dashed), 0.1 (dot-dashed), and 5 (dotted).
Current usage metrics show cumulative count of Article Views (full-text article views including HTML views, PDF and ePub downloads, according to the available data) and Abstracts Views on Vision4Press platform.
Data correspond to usage on the plateform after 2015. The current usage metrics is available 48-96 hours after online publication and is updated daily on week days.
Initial download of the metrics may take a while.