Fig. D.1
Download original image
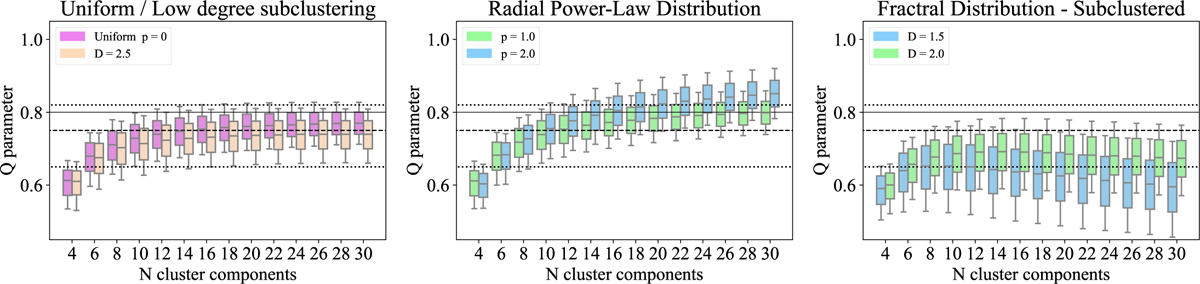
Boxplots representing the distributions of the Q parameter derived from the simulated clusters as a function of the number of cluster components. Each box indicates the median, the first, and the third quartile, while the whiskers extend from the 10th to the 90th percentile of the distribution of measured Q. The left panel compares the results of the simulations with uniform distribution, obtained with p=0, and with the lowest level of subclustering in the simulation campaign, corresponding to a fractal dimension D=2.5. The central panel presents the results for clusters with a radial distribution of their components, for the two cases with exponents p=1 and p=2. The right panel presents the results for clusters with a fractal distribution of their components with two different levels of subclustering, determined by a fractal dimension D=2.0 (mild subclustering) and D=1.5 (high subclustering). The reference values for Q discussed in the text are reported as horizontal lines, corresponding to Q=0.65 and Q=0.83 (dotted lines), 0.75 (dashed line), and the threshold Q=0.8 introduced by Cartwright & Whitworth (2004, thin line).
Current usage metrics show cumulative count of Article Views (full-text article views including HTML views, PDF and ePub downloads, according to the available data) and Abstracts Views on Vision4Press platform.
Data correspond to usage on the plateform after 2015. The current usage metrics is available 48-96 hours after online publication and is updated daily on week days.
Initial download of the metrics may take a while.