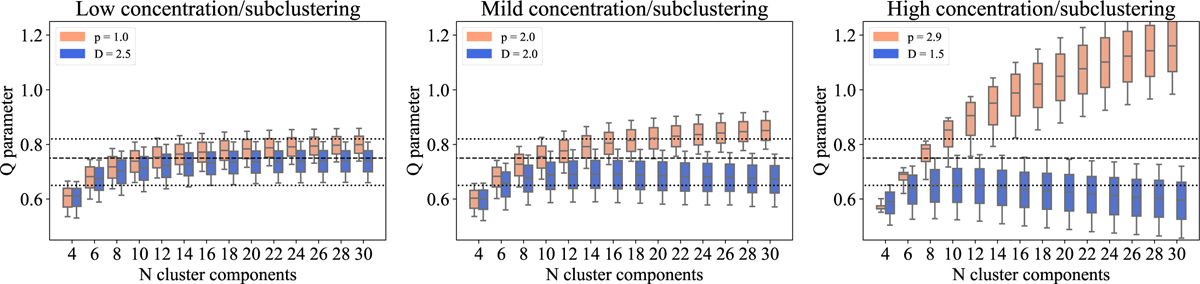
Fig. D.2
Download original image
Same as Fig. D.1, but showing the direct comparison of the distributions of the Q parameter computed from the sets of synthetic clusters with the components distributed with a radial power law and with a fractal distribution. The comparison is shown for sets with low, mild, and high concentration degrees and level of subclustering.
Current usage metrics show cumulative count of Article Views (full-text article views including HTML views, PDF and ePub downloads, according to the available data) and Abstracts Views on Vision4Press platform.
Data correspond to usage on the plateform after 2015. The current usage metrics is available 48-96 hours after online publication and is updated daily on week days.
Initial download of the metrics may take a while.