Fig. 4
Download original image
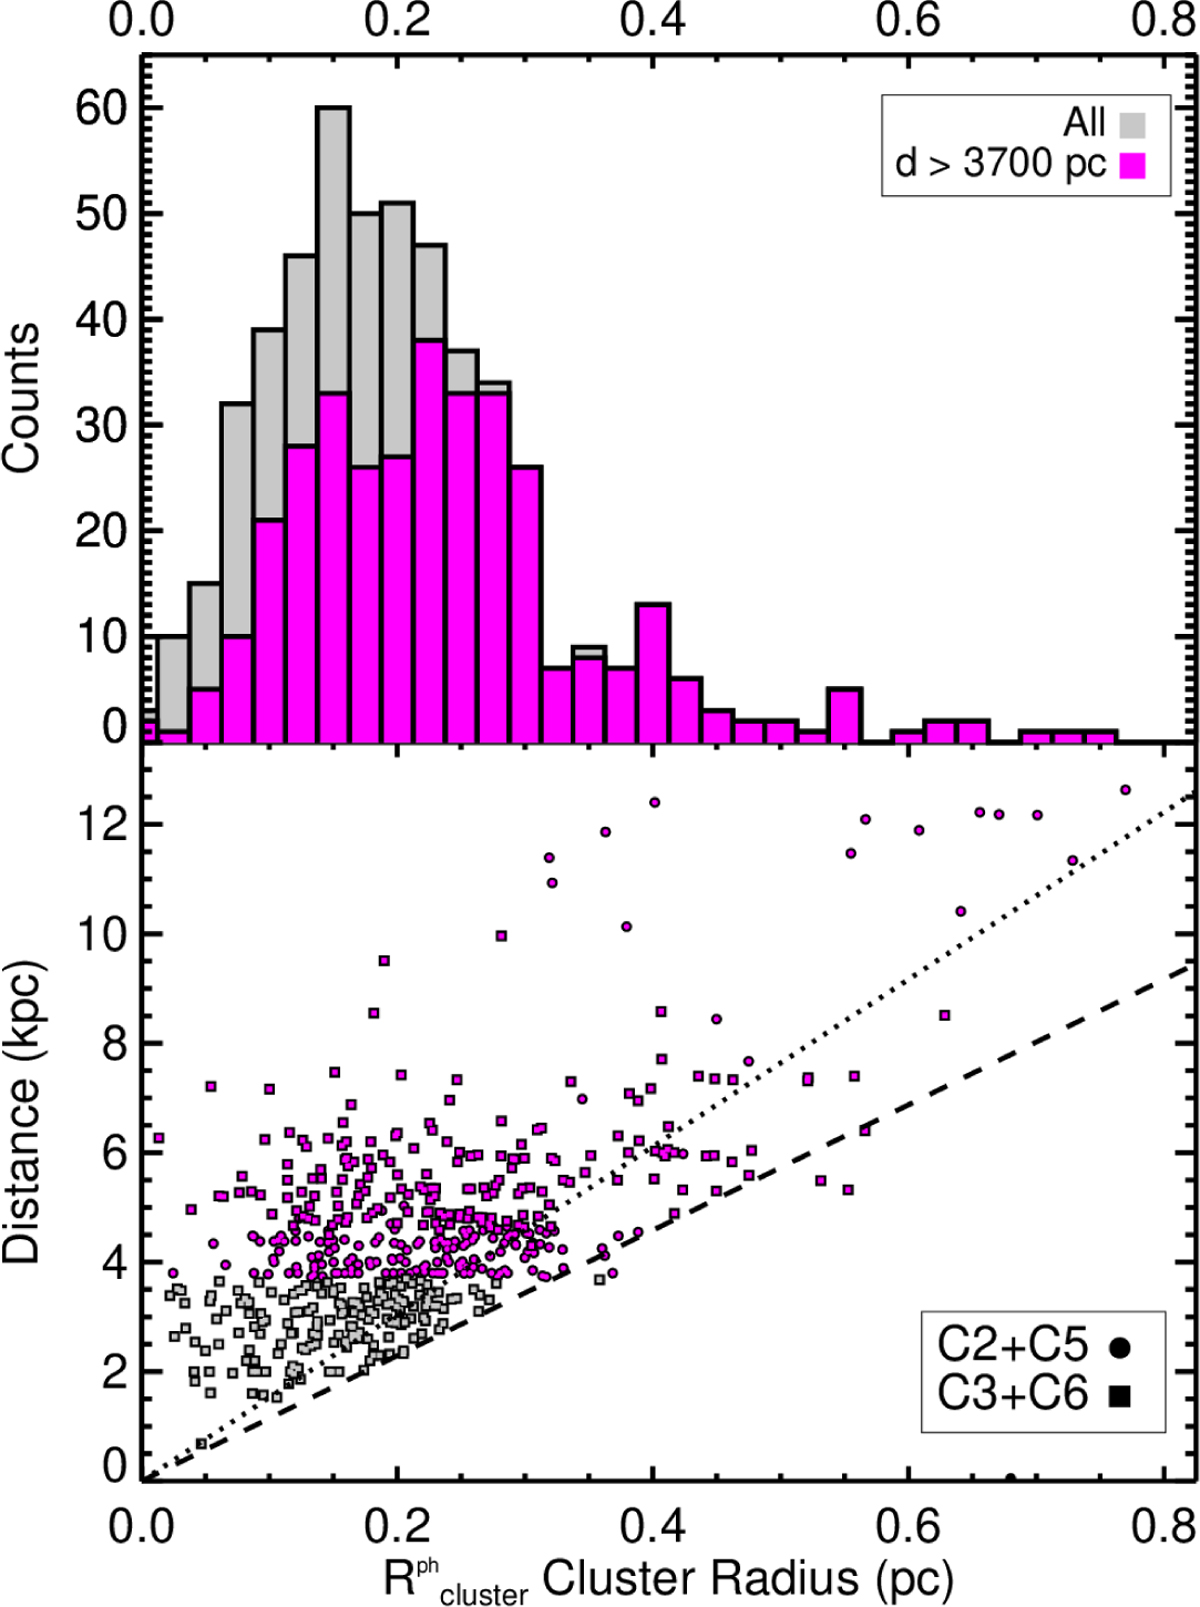
Top panel: distribution of the cluster radius measured from the average core positions for the sample of 514 ALMAGAL clumps with Ncore ≥ 4 (in gray) and the subsample composed 347 clumps with dcl ≥ 3.7 kpc (magenta). Bottom panel: clump heliocentric distance vs. measured cluster radius. The dashed line shows the physical size of the ALMAGAL FoV, while the dotted line indicates the area where the sensitivity is constant within a factor of two, i.e., angular sizes ∼13.5′′. Cluster radii exceeding the FoV sizes are possible in systems with a substantial offset between the cluster and the image center.
Current usage metrics show cumulative count of Article Views (full-text article views including HTML views, PDF and ePub downloads, according to the available data) and Abstracts Views on Vision4Press platform.
Data correspond to usage on the plateform after 2015. The current usage metrics is available 48-96 hours after online publication and is updated daily on week days.
Initial download of the metrics may take a while.