Open Access
Fig. 5
Download original image
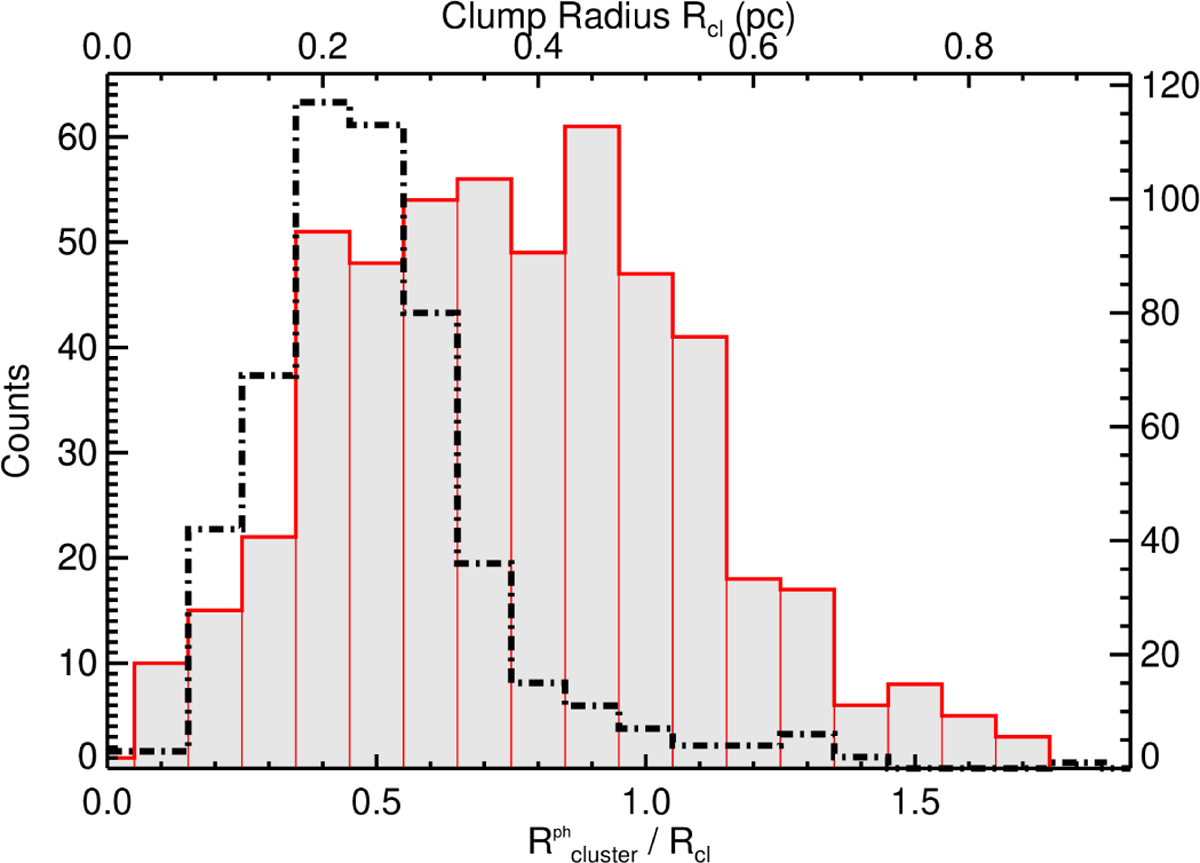
Distribution of the ratio of the radius of the core cluster to the clump radius (gray histogram). The dot-dashed line, which refers to the top and right axes, shows the distribution of the clump radius derived from Herschel Hi-GAL data at 250 μm from Elia et al. (2021).
Current usage metrics show cumulative count of Article Views (full-text article views including HTML views, PDF and ePub downloads, according to the available data) and Abstracts Views on Vision4Press platform.
Data correspond to usage on the plateform after 2015. The current usage metrics is available 48-96 hours after online publication and is updated daily on week days.
Initial download of the metrics may take a while.