Open Access
Fig. 6
Download original image
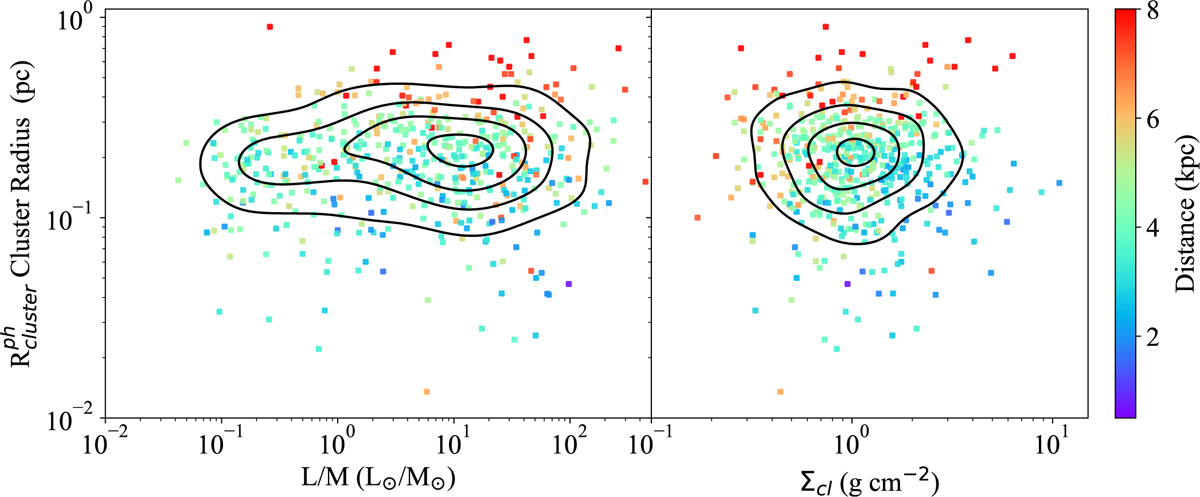
Cluster radius as a function of the clump-averaged properties: L/M (left panel) and surface density Σcl (right panel), color-coded by the clump distance. The black lines indicate the contours of the 2D probability density distribution corresponding to 10, 25, 50, 75, and 95% levels.
Current usage metrics show cumulative count of Article Views (full-text article views including HTML views, PDF and ePub downloads, according to the available data) and Abstracts Views on Vision4Press platform.
Data correspond to usage on the plateform after 2015. The current usage metrics is available 48-96 hours after online publication and is updated daily on week days.
Initial download of the metrics may take a while.