Fig. 7
Download original image
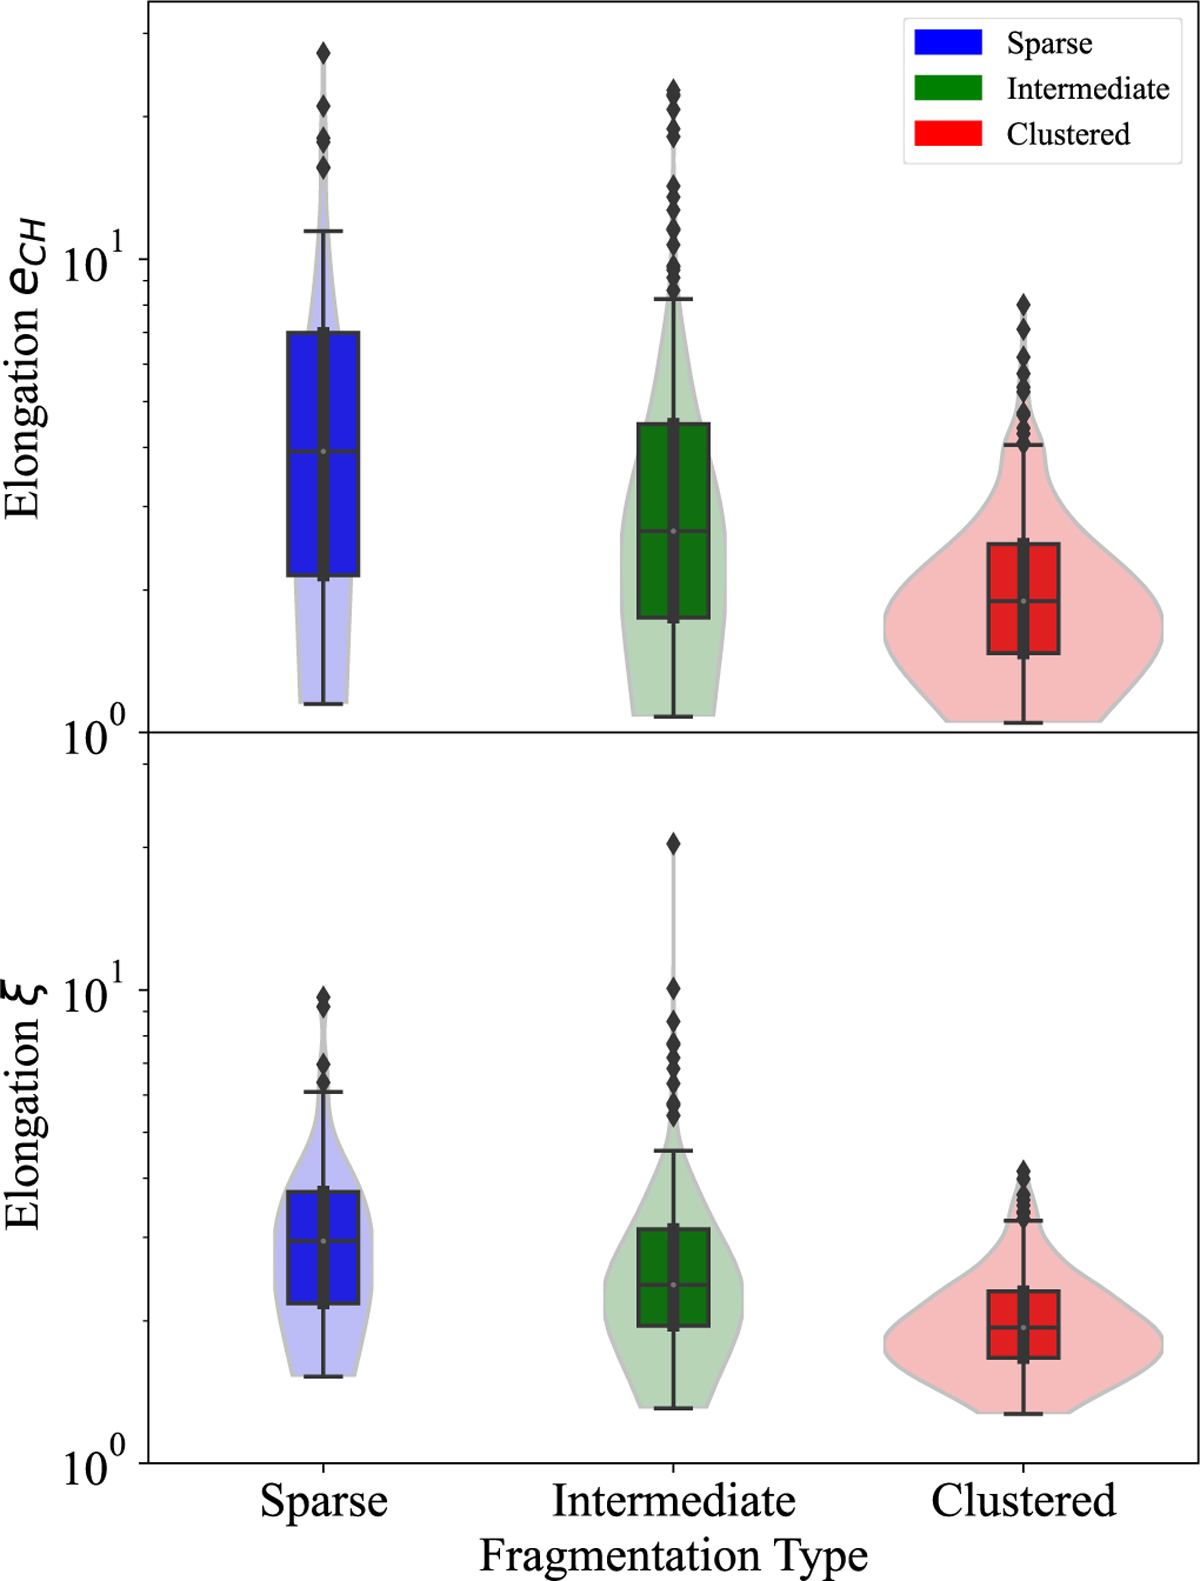
Whisker plots showing the distribution of the two measured estimates of the cluster elongation for the different classes of ALMAGAL clumps identified by the number of cores inside the CH polygon: sparse, where no further core lies inside it; intermediate, where there are fewer cores than the ones defining the polygon itself; clustered, where there are more cores than the ones at polygon vertices. The left panel presents the elongation eCH, defined as the ratio of the major to the minor axis of the best fitting ellipse to the CH polygon, while the right panel refers to the ratio ξ of the circular area of the cluster to the area of the CH polygon. The first and third quartiles, and the 10th and 90th percentiles of the distribution are indicated by the boxes and the segment extremes, respectively, while the central segment corresponds to the median.
Current usage metrics show cumulative count of Article Views (full-text article views including HTML views, PDF and ePub downloads, according to the available data) and Abstracts Views on Vision4Press platform.
Data correspond to usage on the plateform after 2015. The current usage metrics is available 48-96 hours after online publication and is updated daily on week days.
Initial download of the metrics may take a while.