Fig. 8
Download original image
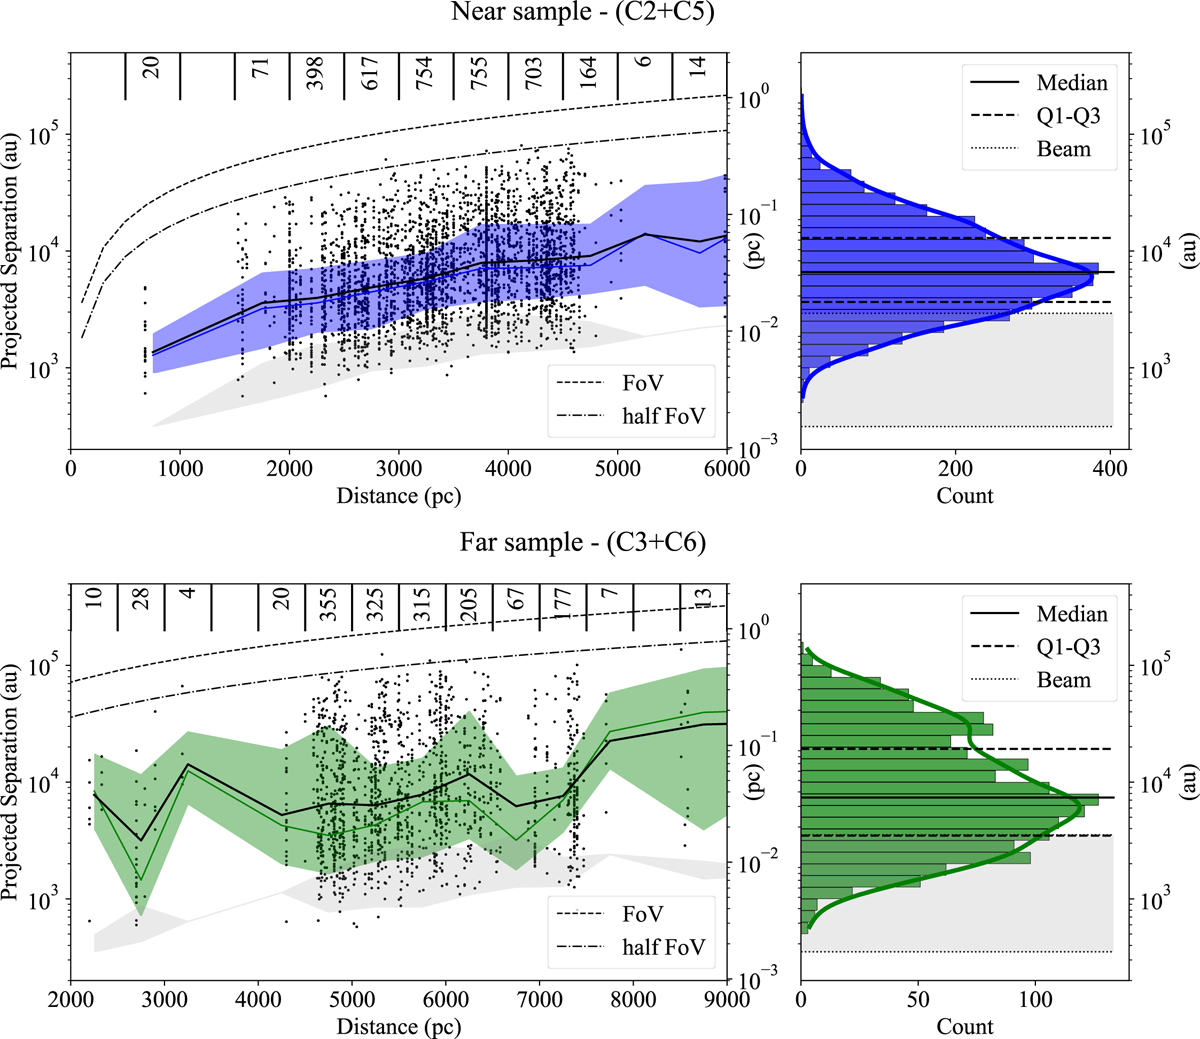
Left panels: linear separation between ALMAGAL cores as a function of the distance of the ALMAGAL clump for near (top panel) and far configuration sample (bottom panel). The gray shaded areas indicate the ranges of the limiting sizes set by the beams of the ALMAGAL images. The black and colored solid lines (blue and green) indicate the median and the mode of the distribution of the separations, respectively, while the colored area traces the distribution width, defined at the 68% peak intensity. The dashed and dotted lines indicates one-half of the observed field and the full field, respectively. The vertical lines show the adopted distance bins with the relative number of the separations. The 20 separations lying below the spatial resolution are found where the beam is strongly elongated, and are larger than the beam minor axis. In addition, a limited number of separations are not included in the figure as they exceed the selected intervals: 180 in the near sample (162 of which have dcl ≥ 9 kpc), and six in the far sample. Right panels: overall distribution of the projected linear separations in the near (top) and far (bottom) sample, respectively. The thick colored lines (blue and green) show the probability distribution function estimated with the KDE method. The gray shaded area indicates the interval spanned by the circularized beams in the corresponding ALMAGAL images.
Current usage metrics show cumulative count of Article Views (full-text article views including HTML views, PDF and ePub downloads, according to the available data) and Abstracts Views on Vision4Press platform.
Data correspond to usage on the plateform after 2015. The current usage metrics is available 48-96 hours after online publication and is updated daily on week days.
Initial download of the metrics may take a while.