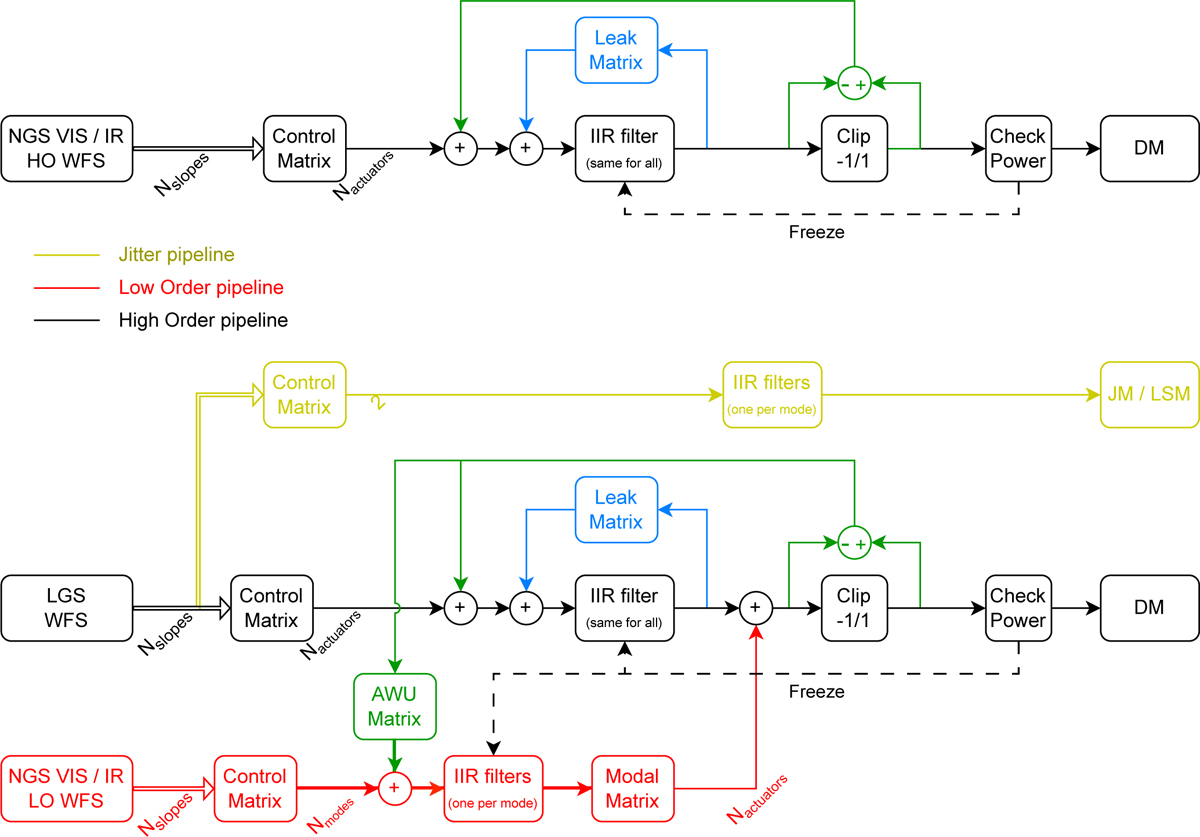
Fig. D.1
Download original image
Simplified diagram of the real-time data-flow within the HRTC of GPAO when configured in NGS_VIS/IR mode (top) and in LGS_VIS/IR mode (bottom), from the slopes vectors computed by the Wavefront Sensors to the command vectors sent to the Deformable Mirror and to the Jitter Mirror. The black path is the HO pipeline, the red path is the LO pipeline, the yellow path is the Jitter pipeline. Each pipeline can be closed independently. The green feedback is the anti-windup and the blue feedback is the modal leak (which also acts as a garbage collector). To ease the reading, the diagram does not include the pre-processing from detector images to slopes, it does not include the reference slopes offsets, and it does not include the real-time disturbances (in slopes and command spaces) than can be input to the data-flow for calibration purposes.
Current usage metrics show cumulative count of Article Views (full-text article views including HTML views, PDF and ePub downloads, according to the available data) and Abstracts Views on Vision4Press platform.
Data correspond to usage on the plateform after 2015. The current usage metrics is available 48-96 hours after online publication and is updated daily on week days.
Initial download of the metrics may take a while.