Fig. 4
Download original image
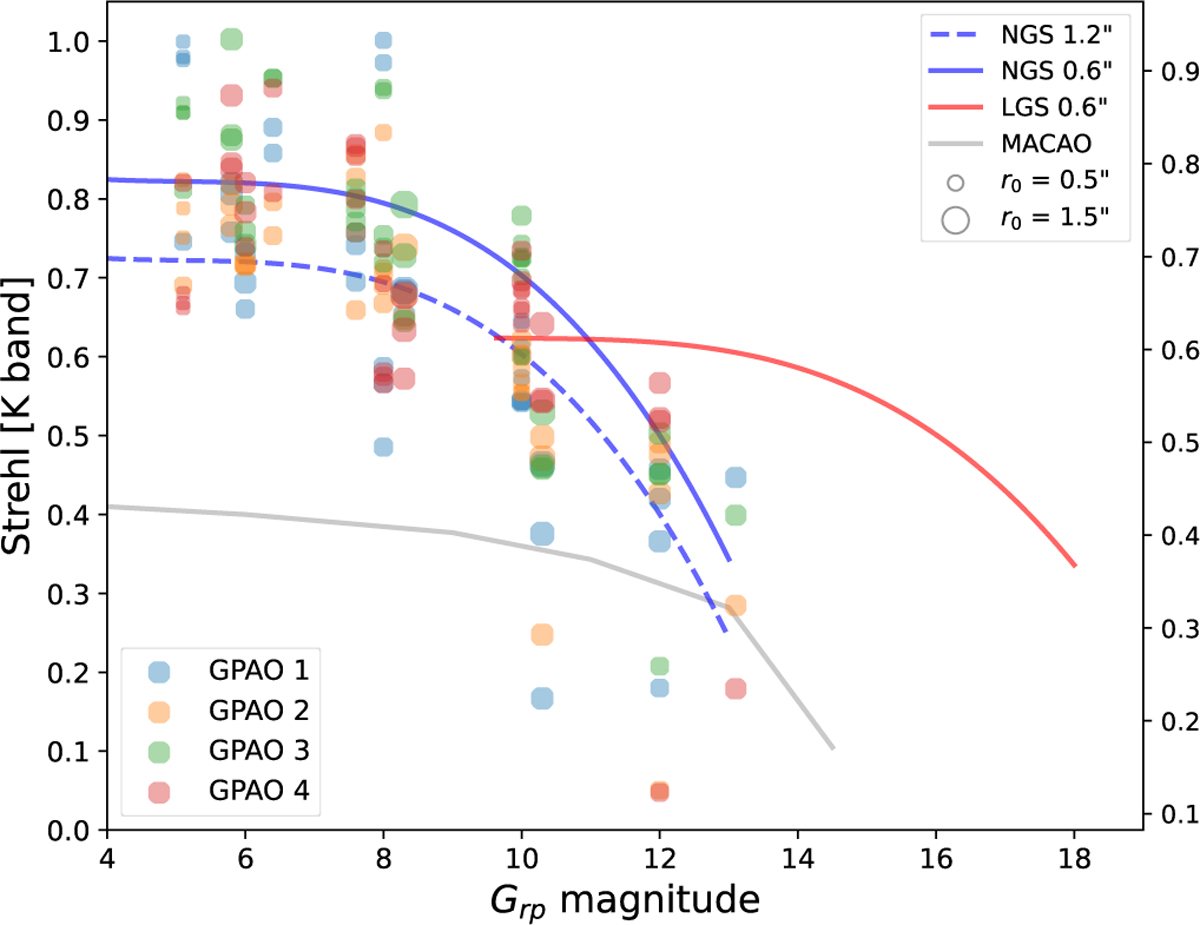
Strehl in the K-band versus the Gaia GRP magnitude of the guide star. Points indicate the measurements with GPAO in NGS_VIS mode. The seeing conditions are proportional to the diameter of the point. The blue curves are the expectations for GPAO in NGS_VIS mode and two seeing values, the red curve is the expectation for GPAO in LGS_VIS mode with seeing 0.6″. The gray curve shows the performance of the former MACAO system of VLTI.
Current usage metrics show cumulative count of Article Views (full-text article views including HTML views, PDF and ePub downloads, according to the available data) and Abstracts Views on Vision4Press platform.
Data correspond to usage on the plateform after 2015. The current usage metrics is available 48-96 hours after online publication and is updated daily on week days.
Initial download of the metrics may take a while.