Fig. 10.
Download original image
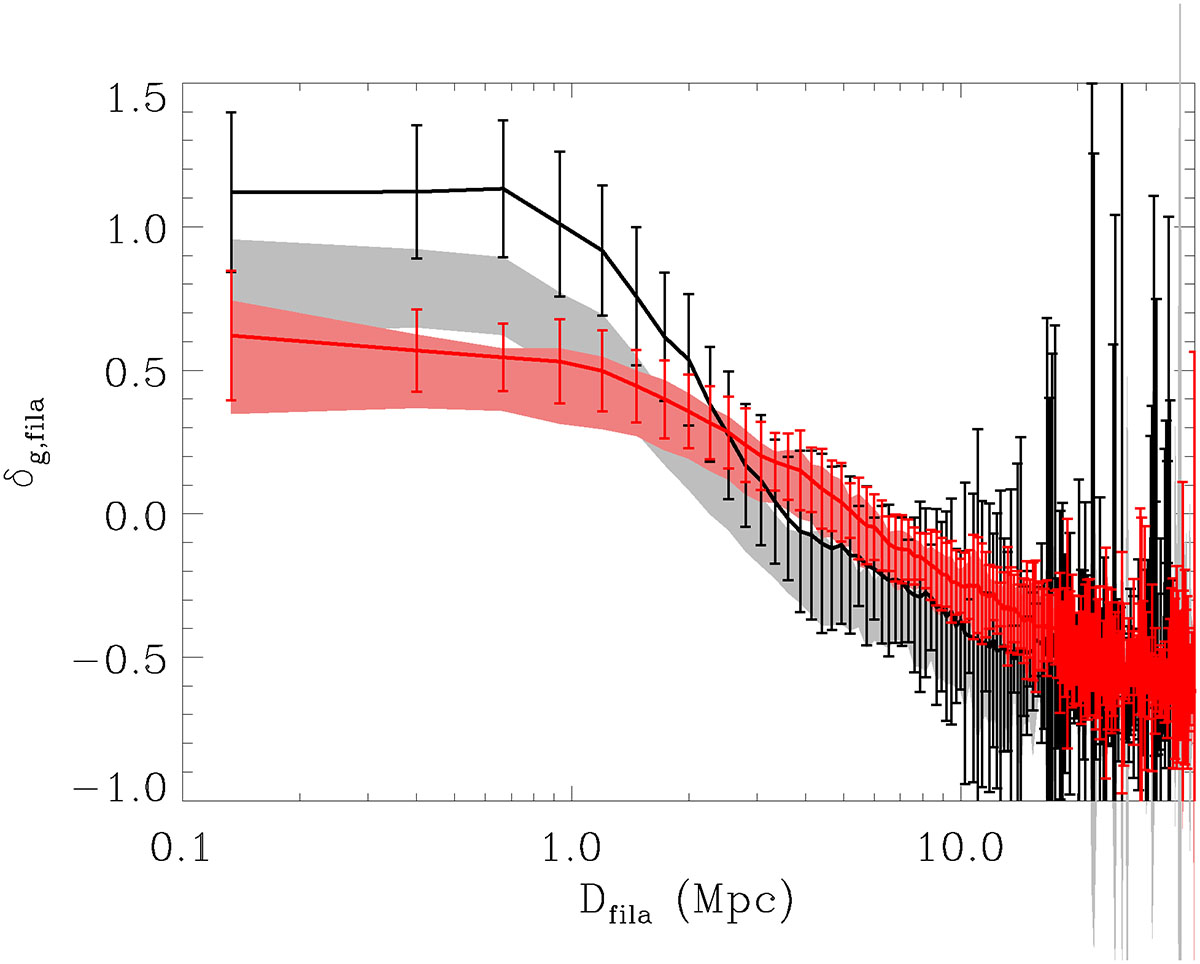
Galaxy overdensity as a function of the distance to the filament spine. The grey and pink shaded regions correspond to the original profiles shown in Fig. 5, computed without applying any stellar mass cut. The black and red solid lines represent the galaxy overdensity profiles for stellar-mass-selected galaxies with log(M/M⊙) > 10.8 in the redshift intervals 0.05 < z < 0.1 and 0.1 < z < 0.2, respectively.
Current usage metrics show cumulative count of Article Views (full-text article views including HTML views, PDF and ePub downloads, according to the available data) and Abstracts Views on Vision4Press platform.
Data correspond to usage on the plateform after 2015. The current usage metrics is available 48-96 hours after online publication and is updated daily on week days.
Initial download of the metrics may take a while.