Fig. 2.
Download original image
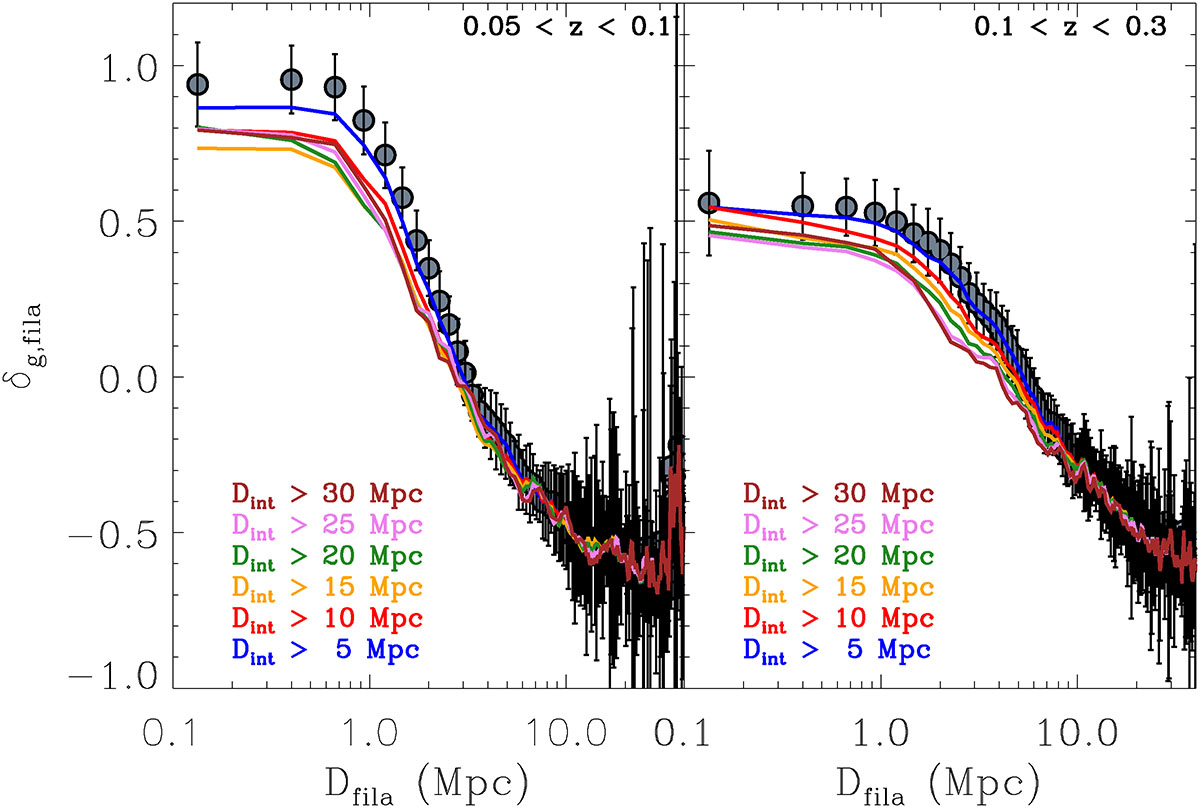
Galaxy overdensity as a function of radial distance from the filament spine for galaxies at 0.05 < z < 0.1 (left panel) and 0.1 < z < 0.3 (right panel). Different symbols and colours indicate the overdensity profiles obtained by excluding galaxies within various distances from the nearest filament intersection: Dint > 0 (grey dots), Dint > 5 Mpc (blue line), Dint > 10 Mpc (red line), Dint > 15 Mpc (yellow line), Dint > 20 Mpc (green line), Dint > 25 Mpc (pink line), and Dint > 30 Mpc (brown line). Uncertainties are calculated as ![]() , where σ is the standard deviation and Np is the number of galaxies in each radial bin.
, where σ is the standard deviation and Np is the number of galaxies in each radial bin.
Current usage metrics show cumulative count of Article Views (full-text article views including HTML views, PDF and ePub downloads, according to the available data) and Abstracts Views on Vision4Press platform.
Data correspond to usage on the plateform after 2015. The current usage metrics is available 48-96 hours after online publication and is updated daily on week days.
Initial download of the metrics may take a while.