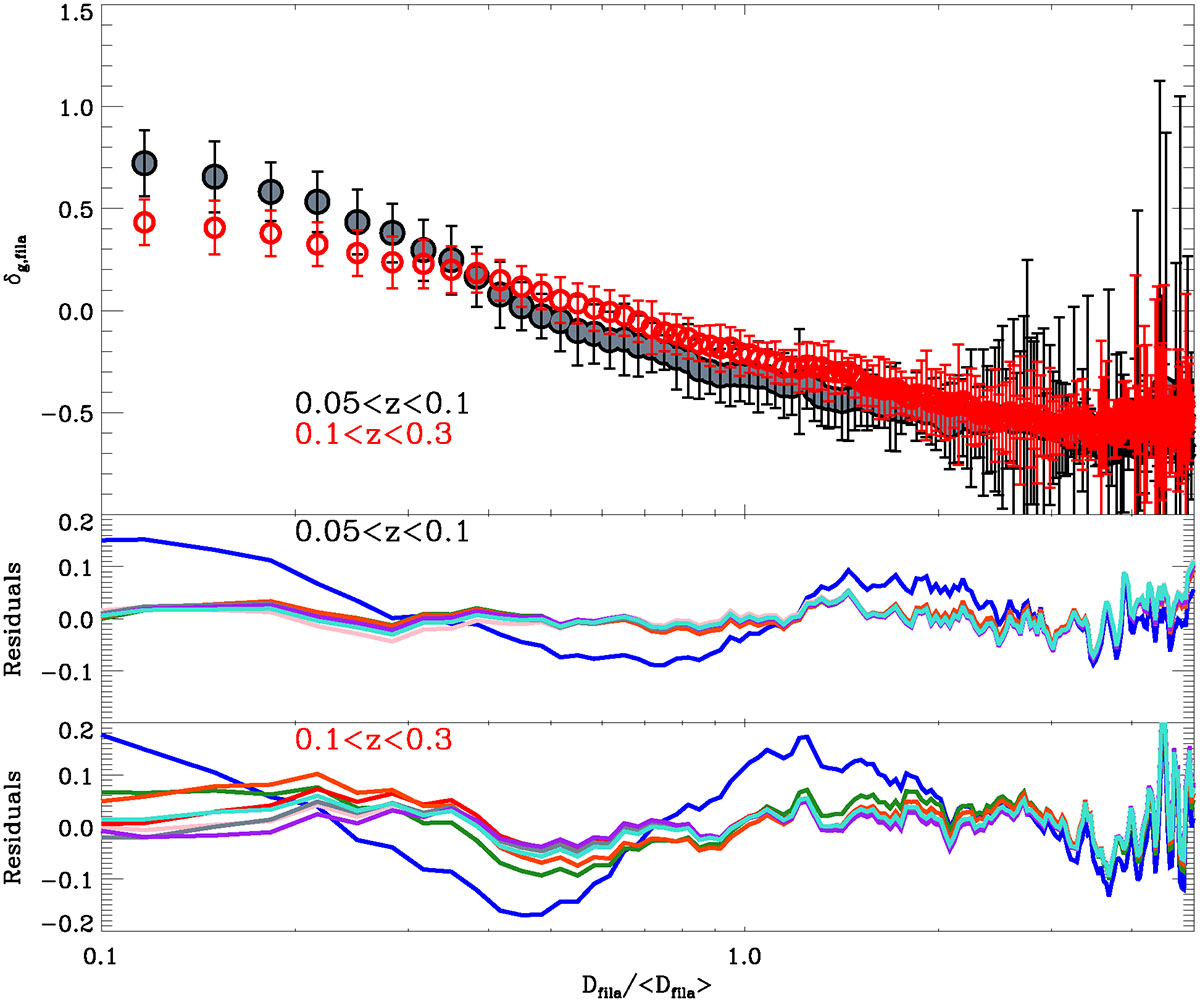
Fig. 7.
Download original image
Galaxy overdensity as a function of the normalised distance to the filament skeleton (top panel). Grey and red points represent the overdensity profiles for galaxies in the redshift ranges 0.05 < z < 0.1 and 0.1 < z < 0.3, respectively. The residuals of the fits are displayed in the middle panel for filaments at 0.05 < z < 0.1, and in the bottom panel for filaments at 0.1 < z < 0.3. The colour coding of both residuals and uncertainties follows the same scheme as in Fig. 4.
Current usage metrics show cumulative count of Article Views (full-text article views including HTML views, PDF and ePub downloads, according to the available data) and Abstracts Views on Vision4Press platform.
Data correspond to usage on the plateform after 2015. The current usage metrics is available 48-96 hours after online publication and is updated daily on week days.
Initial download of the metrics may take a while.