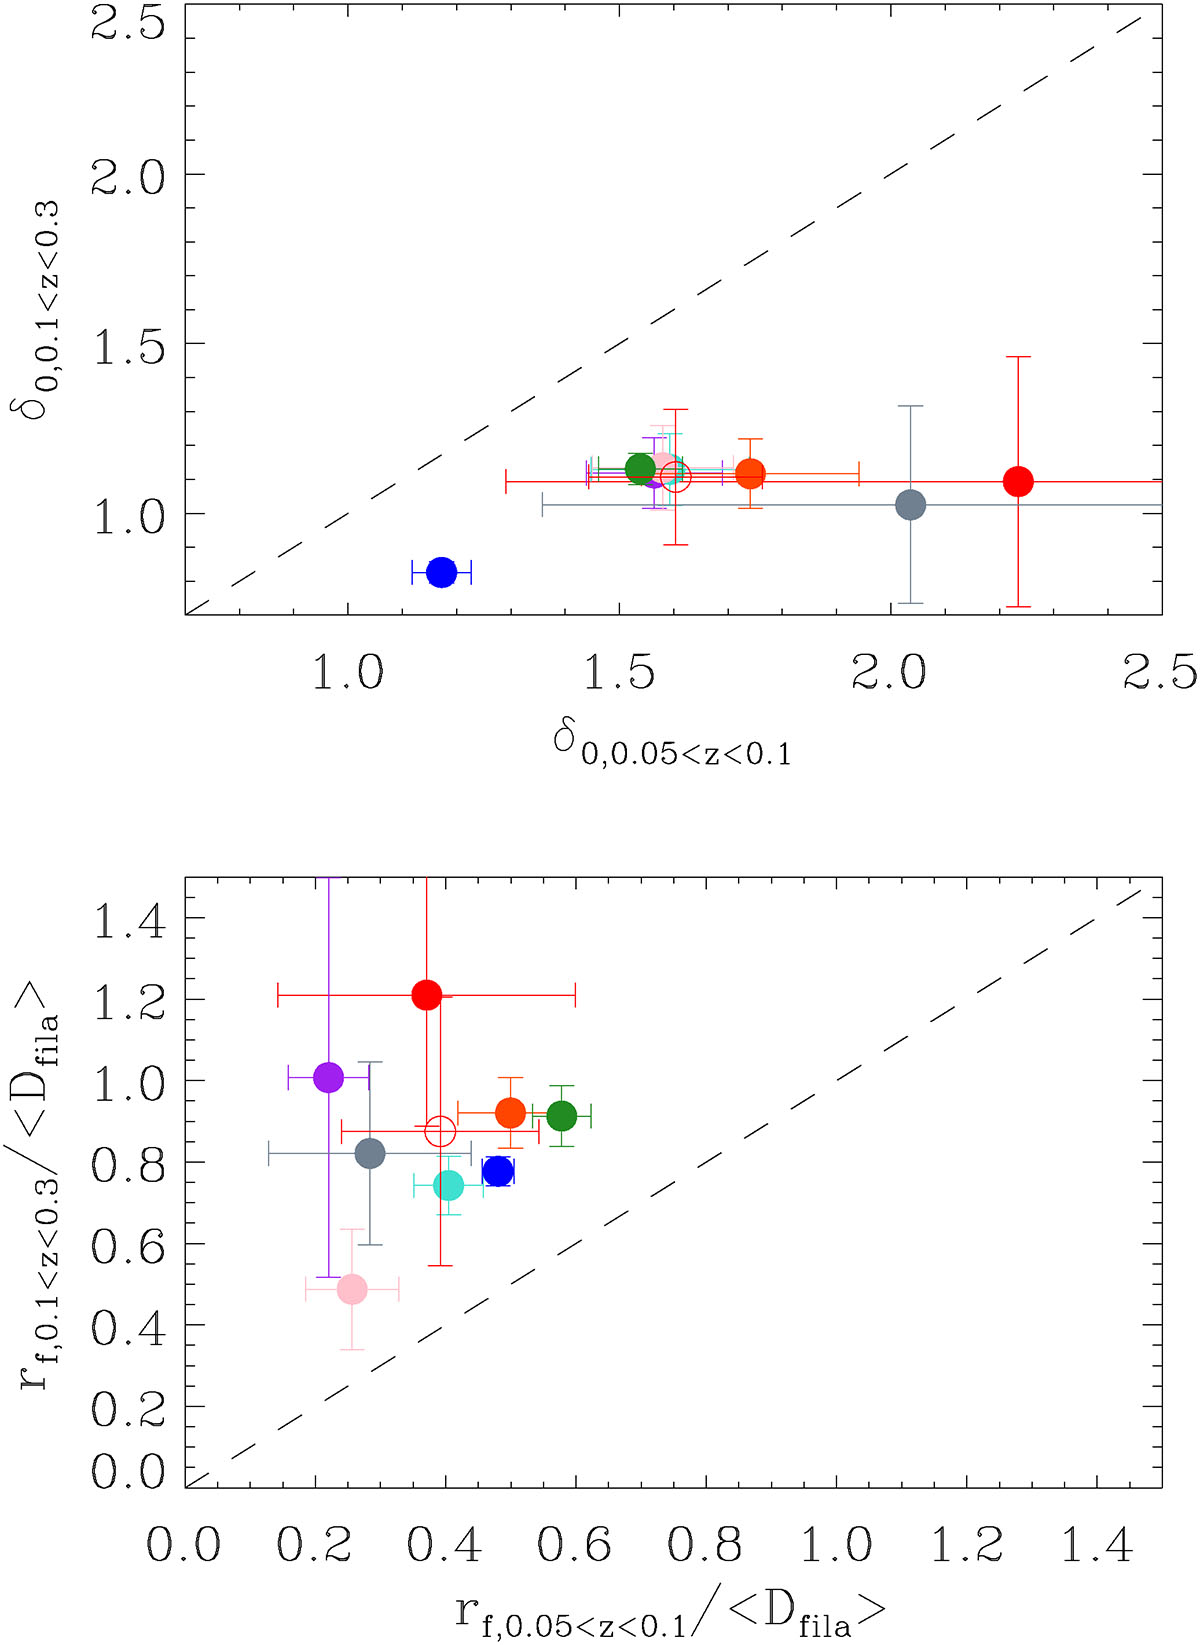
Fig. 8.
Download original image
Central galaxy overdensity (upper panel) and normalised filament scales (lower panel) for filaments located at 0.05 < z < 0.1 and 0.1 < z < 0.3. Red open symbols indicate the mean values, including uncertainties. The dashed line represents the one-to-one relation of the panels. The color code of the full points represent the different fitted models as in Fig. 4.
Current usage metrics show cumulative count of Article Views (full-text article views including HTML views, PDF and ePub downloads, according to the available data) and Abstracts Views on Vision4Press platform.
Data correspond to usage on the plateform after 2015. The current usage metrics is available 48-96 hours after online publication and is updated daily on week days.
Initial download of the metrics may take a while.