Fig. 9.
Download original image
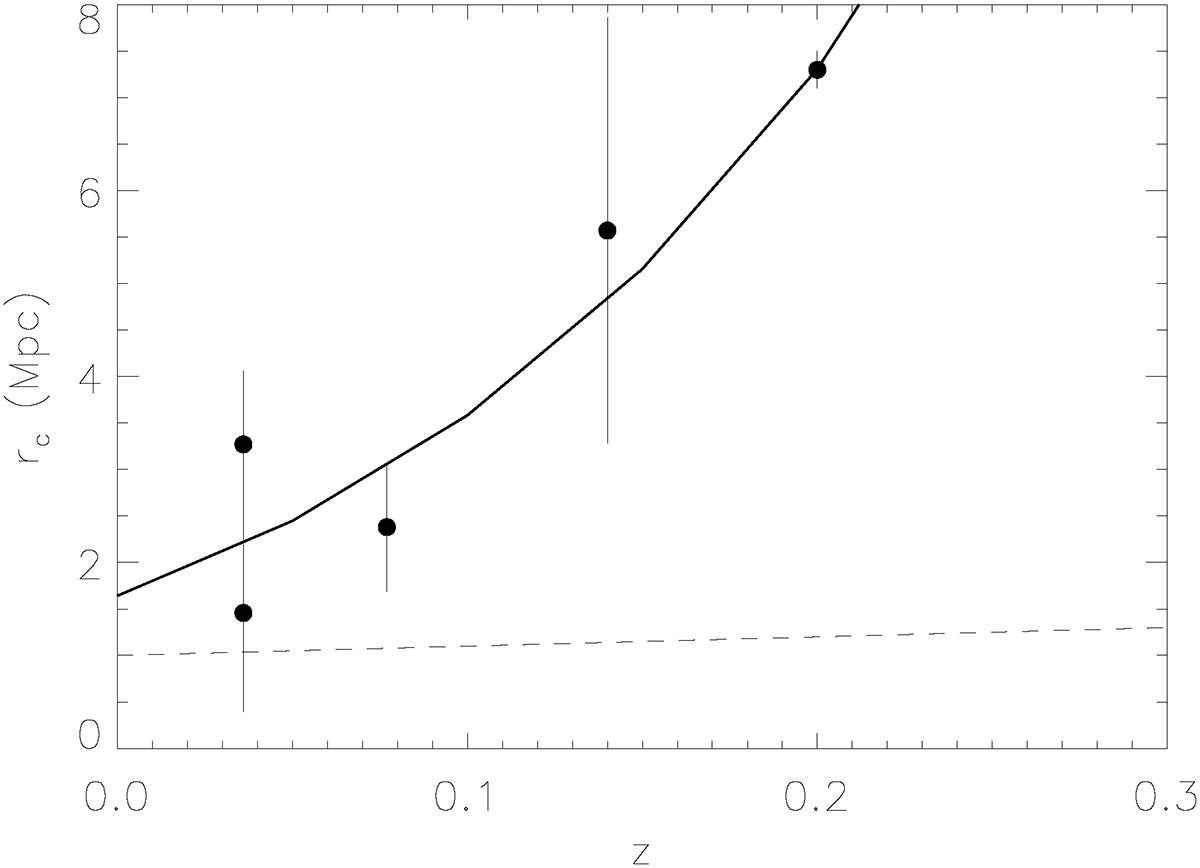
Scales of the filament densities from literature as a function of redshift. The points represents the filament scales from: Virgo cluster (z = 0.036), this work (z = 0.07 and z = 0.14), and Bonjean et al. (2020) (z = 0.2) The solid line represents the fit rfila ∝ (1 + z)α, the dashed-line shows a linear relation with (1 + z).
Current usage metrics show cumulative count of Article Views (full-text article views including HTML views, PDF and ePub downloads, according to the available data) and Abstracts Views on Vision4Press platform.
Data correspond to usage on the plateform after 2015. The current usage metrics is available 48-96 hours after online publication and is updated daily on week days.
Initial download of the metrics may take a while.