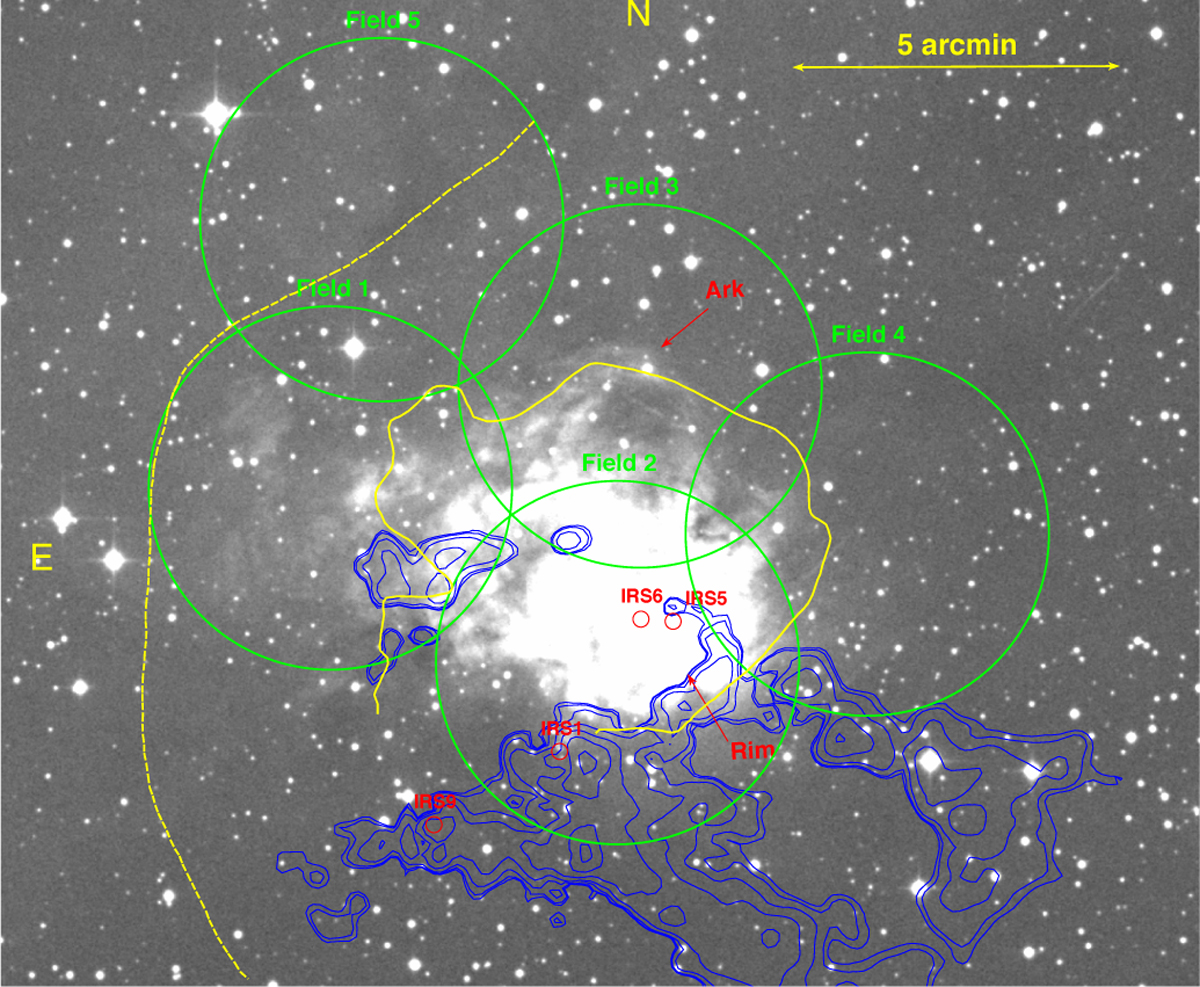
Fig. 1
Download original image
Position of the five observed fields overploted on the DSS-Red image. Yellow isocontours are the inner and the outer (dashed) PDRs boundaries as defined by Luisi et al. (2016) and delineated here from the HERSCHEL−70 μm image. The blue isocontours plot the column density (from 1.6 1021 to 1.2 1024 cm−2) constructed from Hi-GAL survey maps (Marsh et al. 2017). In red are indicated the main infrared sources and the particular features named ‘Ark’ and ‘Rim’.
Current usage metrics show cumulative count of Article Views (full-text article views including HTML views, PDF and ePub downloads, according to the available data) and Abstracts Views on Vision4Press platform.
Data correspond to usage on the plateform after 2015. The current usage metrics is available 48-96 hours after online publication and is updated daily on week days.
Initial download of the metrics may take a while.