Open Access
Fig. 10
Download original image
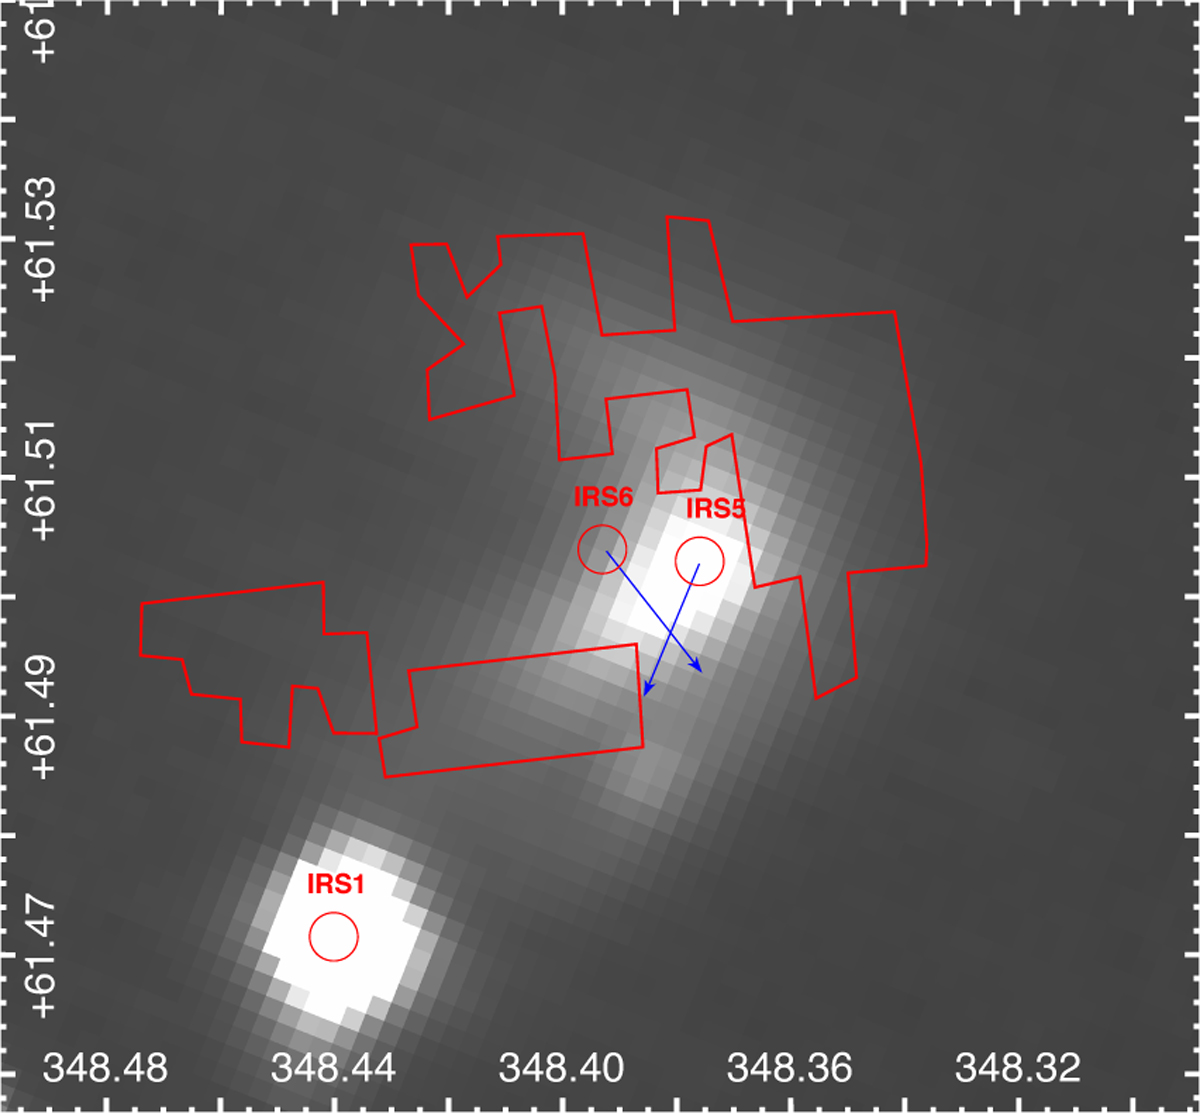
MSX-21.3 μm image (with decimal equatorial J2000 coordinates). The −35 km s−1 component mask is overlaid (red contours). The positions of IRS1, IRS5 and IRS6 are indicated by red circles. The transverse velocity direction of IRS6 and IRS5 are indicated by blue arrows (arbitrary length).
Current usage metrics show cumulative count of Article Views (full-text article views including HTML views, PDF and ePub downloads, according to the available data) and Abstracts Views on Vision4Press platform.
Data correspond to usage on the plateform after 2015. The current usage metrics is available 48-96 hours after online publication and is updated daily on week days.
Initial download of the metrics may take a while.