Fig. 2
Download original image
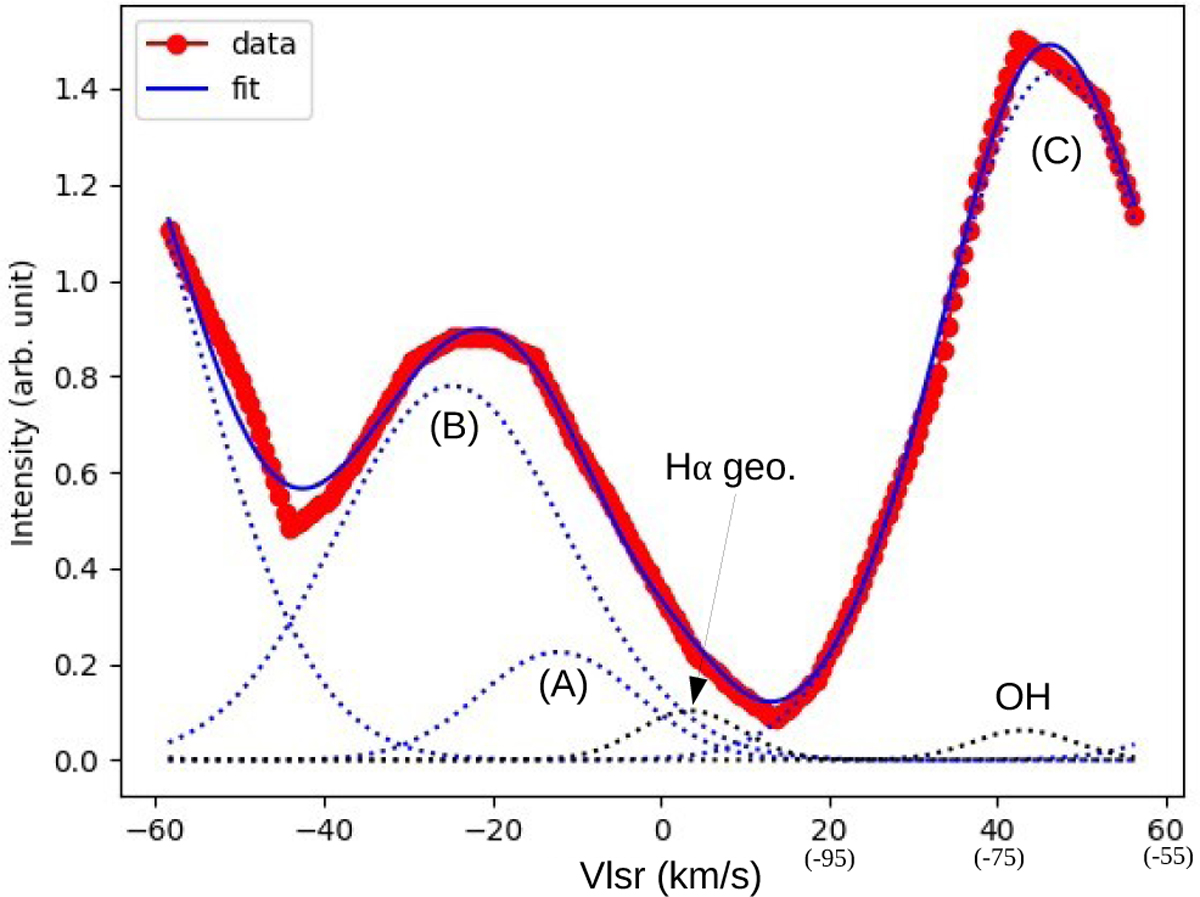
Example of profile decomposition. The dotted blue and black lines are the Hα emissions (labeled A, B, and C) and night-sky (labeled ‘Hα geo.’ and ‘OH’) components, respectively. On the x-axis the velocities corrected for the free spectral range are shown in parentheses. The blue and the red plots are the observed and the fitted profiles, respectively.
Current usage metrics show cumulative count of Article Views (full-text article views including HTML views, PDF and ePub downloads, according to the available data) and Abstracts Views on Vision4Press platform.
Data correspond to usage on the plateform after 2015. The current usage metrics is available 48-96 hours after online publication and is updated daily on week days.
Initial download of the metrics may take a while.