Fig. 7
Download original image
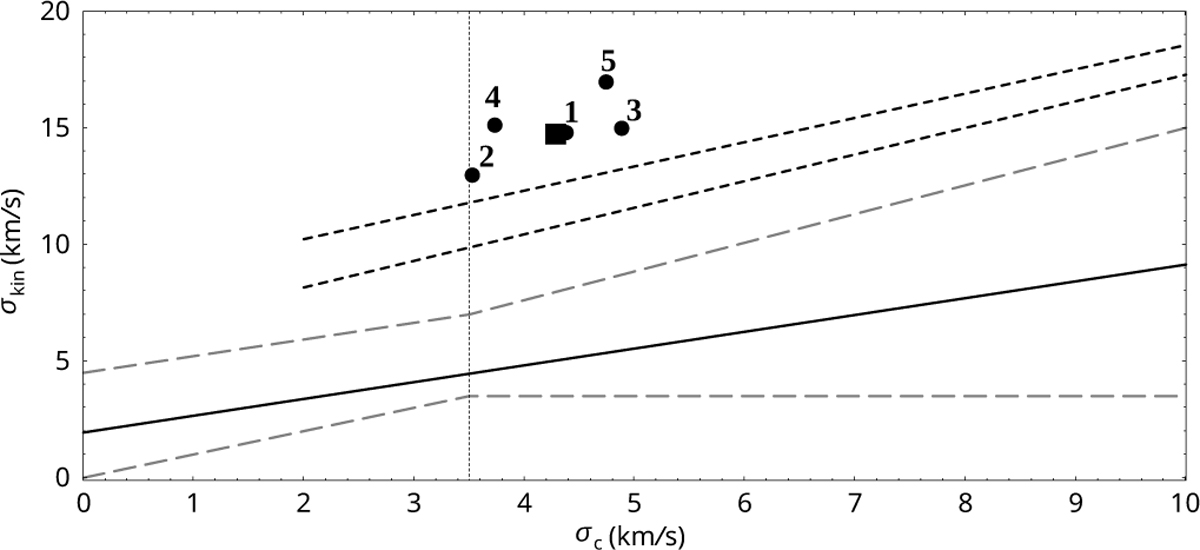
Line-of-sight dispersion, σkin, versus the mean standard deviation, σc, diagram. Fields 1 to 5 are plotted with filled circles and the filled square shows their average. The two dashed lines are from Lagrois et al. (2011) and correspond to the fits applied to M33 H II region samples. The dashed grey lines delineate the spread of the models results around the solid line, which indicates the linear regression applied to the whole sample models (with different angle of inclination). The vertical line indicates the rough separation between the wind-less Champagne flow models (on the left) and the Champagne flow perturbed by the expanding wind-blown bubble models (on the right).
Current usage metrics show cumulative count of Article Views (full-text article views including HTML views, PDF and ePub downloads, according to the available data) and Abstracts Views on Vision4Press platform.
Data correspond to usage on the plateform after 2015. The current usage metrics is available 48-96 hours after online publication and is updated daily on week days.
Initial download of the metrics may take a while.