Open Access
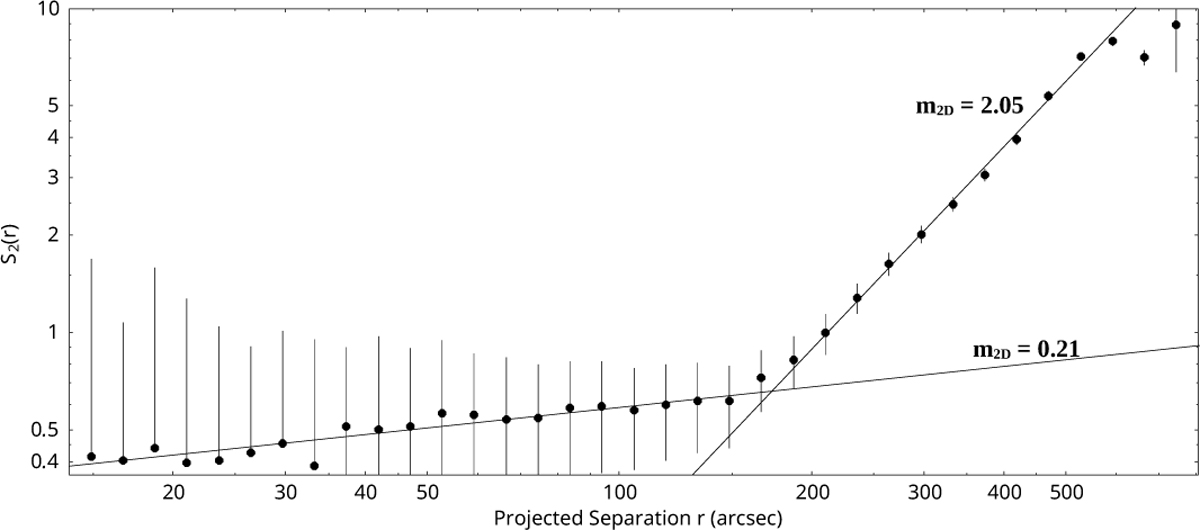
Fig. 9
Download original image
Log-log plot of the second-order structure function S2(r) for the full area. The fitted power law are shown and their indices are indicated in the panel.
Current usage metrics show cumulative count of Article Views (full-text article views including HTML views, PDF and ePub downloads, according to the available data) and Abstracts Views on Vision4Press platform.
Data correspond to usage on the plateform after 2015. The current usage metrics is available 48-96 hours after online publication and is updated daily on week days.
Initial download of the metrics may take a while.