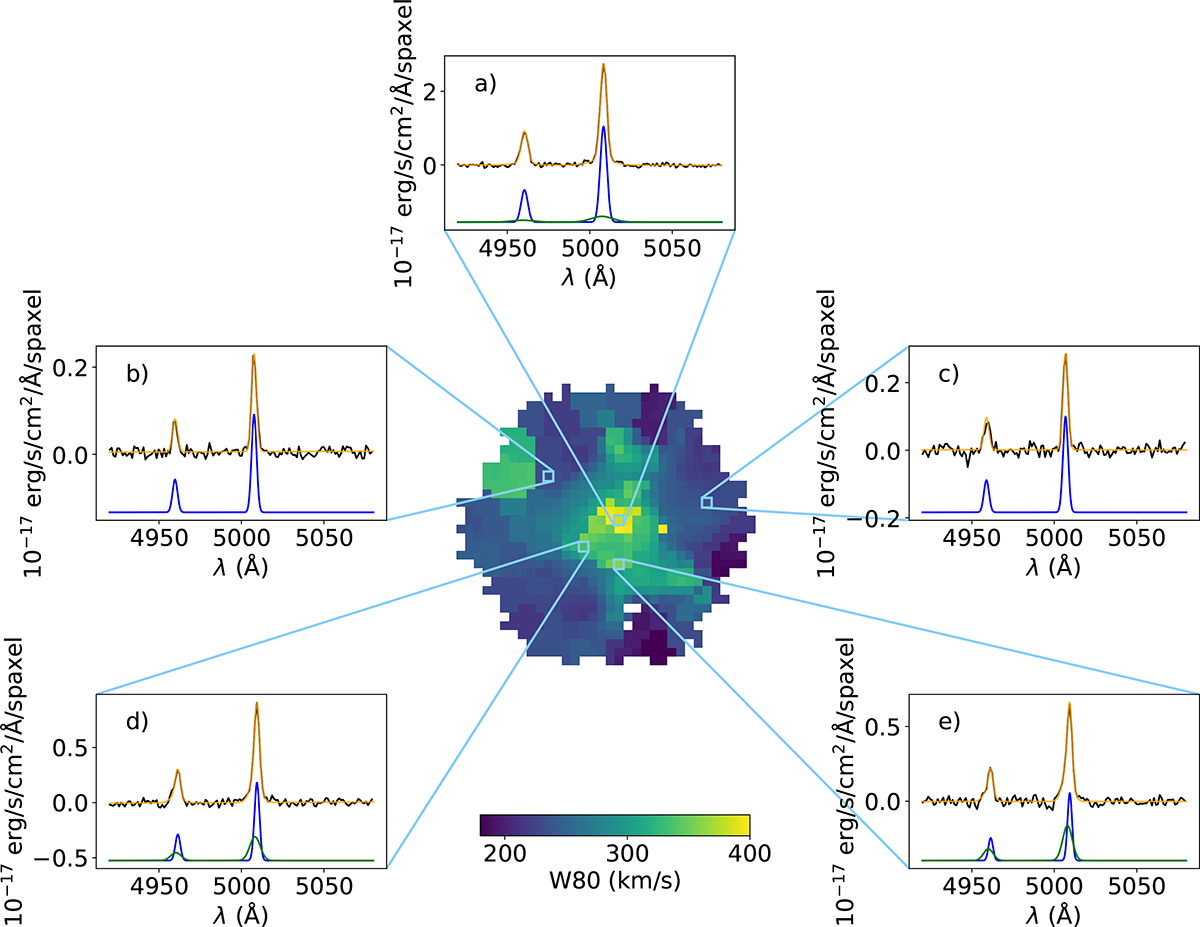
Fig. C.1.
Download original image
Examples of our fitting procedure in individual spaxels (for MaNGA plate-IFU: 9090-3704). The central image is the W80 map for this target. The black line shows the original spectra, and the yellow line is our final fit. The blue and green lines are the Gaussian sub-components of the fit (they have been offset on the y-axis). If a panel has only one (blue) component (e.g., panel b or c), the single-Gaussian fit is best to model the spectrum.
Current usage metrics show cumulative count of Article Views (full-text article views including HTML views, PDF and ePub downloads, according to the available data) and Abstracts Views on Vision4Press platform.
Data correspond to usage on the plateform after 2015. The current usage metrics is available 48-96 hours after online publication and is updated daily on week days.
Initial download of the metrics may take a while.