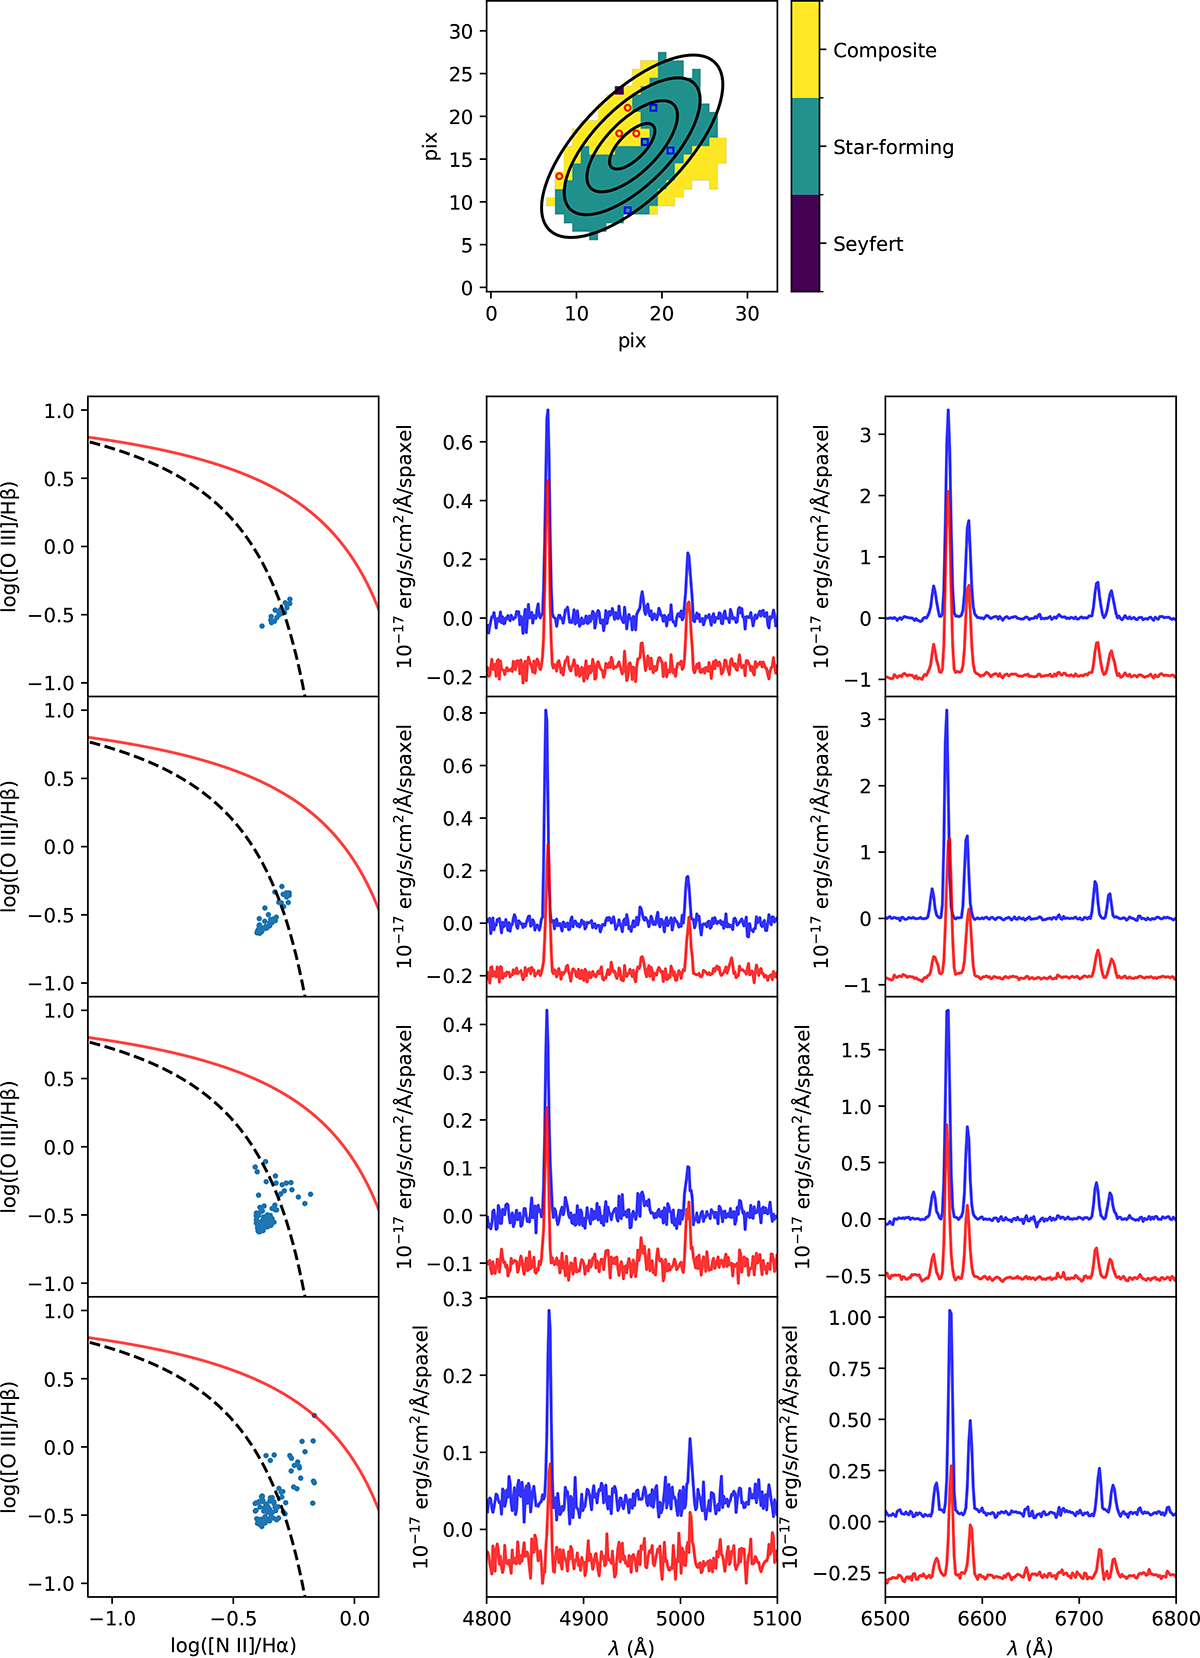
Fig. C.2.
Download original image
Spectra from individual spaxels at different annuli (for MaNGA plate-IFU: 8950-1901). The top plot illustrates the optical classification map based on the [N II] BPT diagram following Kewley et al. (2006). The black ellipses display annuli spaced at 0.5 Reff. The four subsequent rows represent, at different annuli (as in Figure 5), the distribution of the [N II] BPT diagram and spectra zoomed into two spectral regions containing the lines responsible for the classification. The exact spaxel where the spectra is taken from at each annuli is marked in the top panel (using a square for the blue spectra, and a circle for the red ones). The red spectra is offset in the y-axis.
Current usage metrics show cumulative count of Article Views (full-text article views including HTML views, PDF and ePub downloads, according to the available data) and Abstracts Views on Vision4Press platform.
Data correspond to usage on the plateform after 2015. The current usage metrics is available 48-96 hours after online publication and is updated daily on week days.
Initial download of the metrics may take a while.