Open Access
Fig. 4.
Download original image
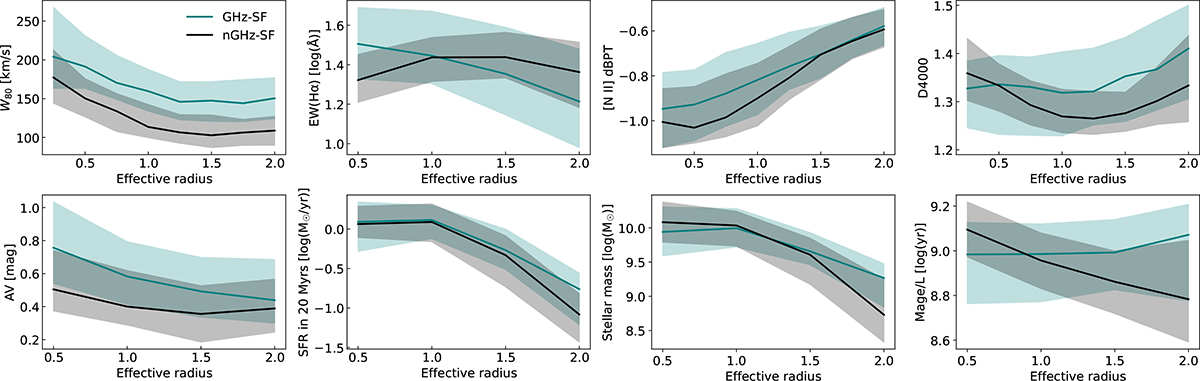
Comparison of modeled and empirically resolved properties between GHz-SFs and nGHz-SFs. The solid lines represent the median value at each annulus and the shaded region represents the 25th and 75th percentiles. The empirical properties are located in the top row, and the modeled, in the bottom row.
Current usage metrics show cumulative count of Article Views (full-text article views including HTML views, PDF and ePub downloads, according to the available data) and Abstracts Views on Vision4Press platform.
Data correspond to usage on the plateform after 2015. The current usage metrics is available 48-96 hours after online publication and is updated daily on week days.
Initial download of the metrics may take a while.