Fig. 5.
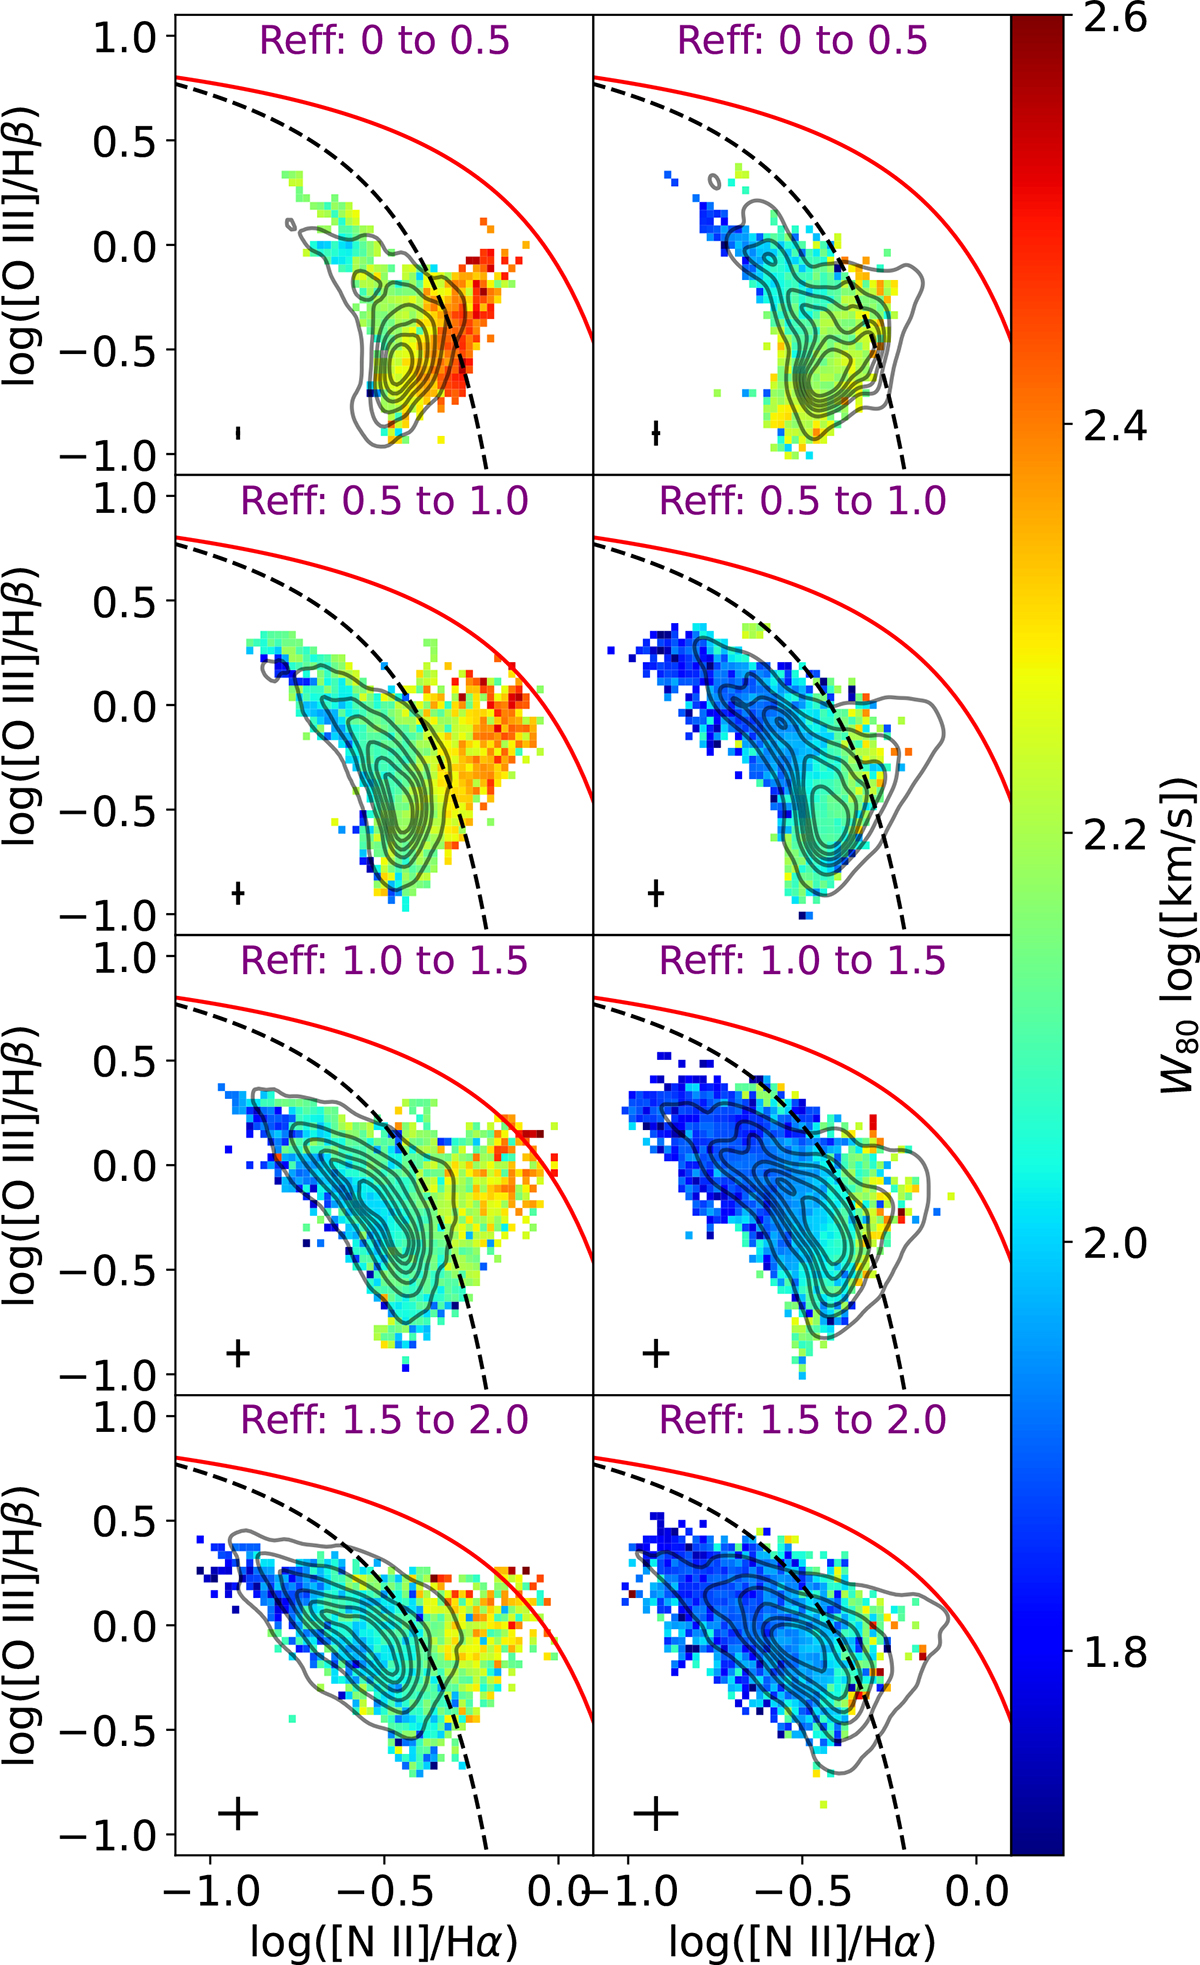
Download original image
Resolved emission line ratios binned by their W80. The first column of plots shows the positions of the spaxels (from the DAP, see Section 2.1.1) binned by W80 for GHz-SFs. The second column shows the same for nGHz-SFs. The distribution of the emission-line ratio spaxels of either GHz-SF or nGHz-SFs is shown in the opposite columns using black contours (see Sect. 4.4). For example, in the left column, W80 is binned for GHz-SF, but the contours show the spaxel distribution of nGHz-SF. In all plots, the Kewley et al. (2001) and Kauffmann et al. (2003) lines for transition objects and extreme starbursts are shown in the red solid and black dashed lines, respectively. Bins where fewer than three scatter points were present have been excluded. On the bottom left of each plot, we display representative error bars (in black) for the individual scatter points that compose the shown binning.
Current usage metrics show cumulative count of Article Views (full-text article views including HTML views, PDF and ePub downloads, according to the available data) and Abstracts Views on Vision4Press platform.
Data correspond to usage on the plateform after 2015. The current usage metrics is available 48-96 hours after online publication and is updated daily on week days.
Initial download of the metrics may take a while.