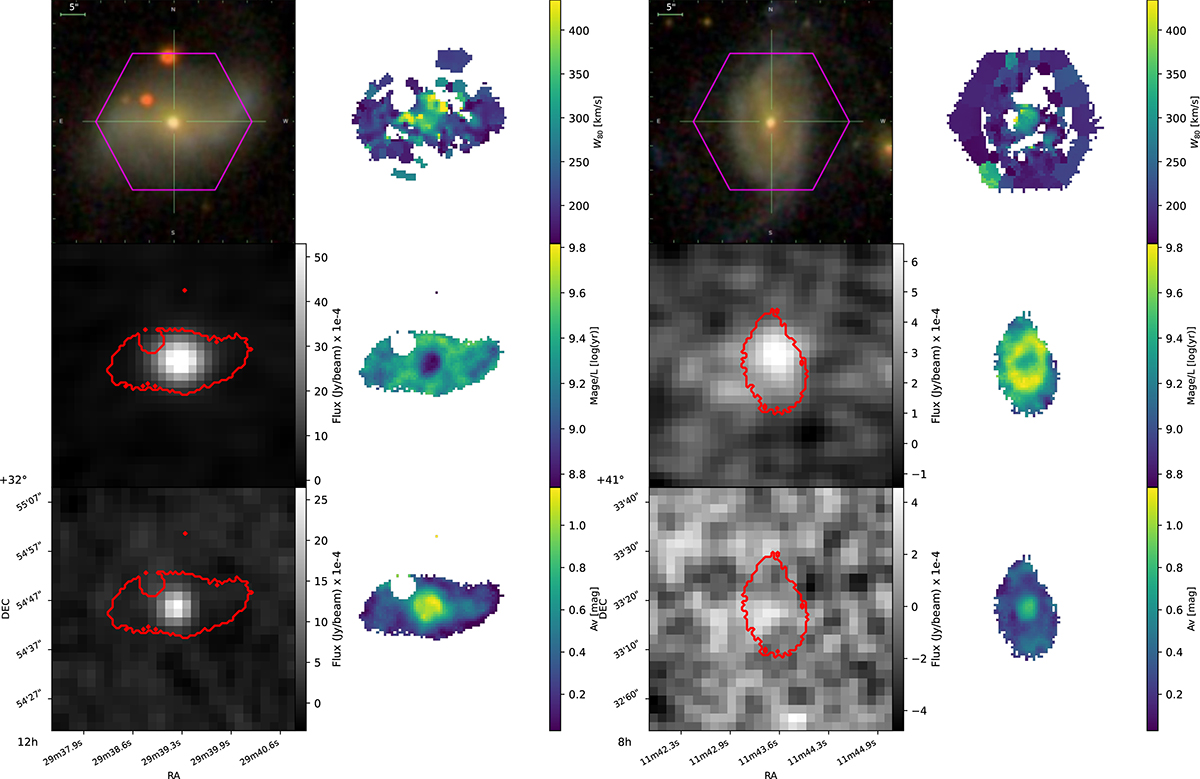
Fig. 6.
Download original image
Continuum and spatially resolved properties from a pair of galaxies of the main sample. We show four columns of plots, where the two left columns correspond to GHz-SF and the right ones to nGHz-SF. The GHz-SF and nGHz-SF shown here are twins (control sample pairs) in the parameter space defined in Section 3. The left column in each shows the SDSS optical image at the top, the LOFAR sky cut in the same region as shown in SDSS is seen in the middle, and the FIRST counterpart at the bottom. The right columns show MaNGA’s spatially resolved properties. At the top, the W80, at the middle, the age-weighted luminosity, and at the bottom, the Visual extinction. The red regions in the radio continuum images display the region of MaNGA’s coverage.
Current usage metrics show cumulative count of Article Views (full-text article views including HTML views, PDF and ePub downloads, according to the available data) and Abstracts Views on Vision4Press platform.
Data correspond to usage on the plateform after 2015. The current usage metrics is available 48-96 hours after online publication and is updated daily on week days.
Initial download of the metrics may take a while.