Fig. 1.
Download original image
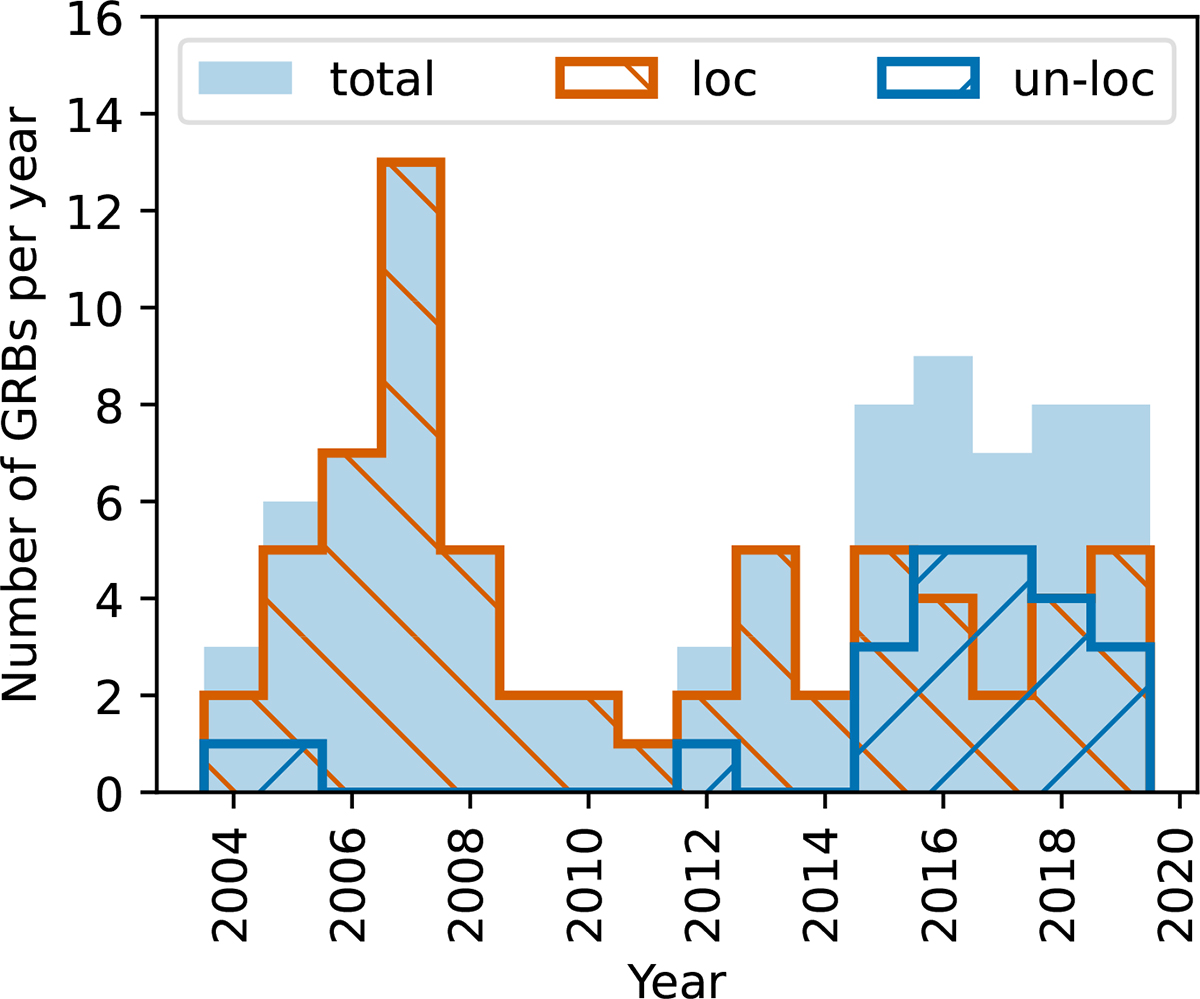
Distribution of GRB follow-ups performed with H.E.S.S. between 2004 and 2019. A total of 89 GRBs are considered in the analysis, classified as either well-localised (loc, typically Swift/BAT alerts with position uncertainty ≲3′) or poorly localised (un-loc, mostly Fermi/GBM alerts with uncertainty ≳0.2°) as detailed in Sect. 3.1.
Current usage metrics show cumulative count of Article Views (full-text article views including HTML views, PDF and ePub downloads, according to the available data) and Abstracts Views on Vision4Press platform.
Data correspond to usage on the plateform after 2015. The current usage metrics is available 48-96 hours after online publication and is updated daily on week days.
Initial download of the metrics may take a while.