Fig. 10.
Download original image
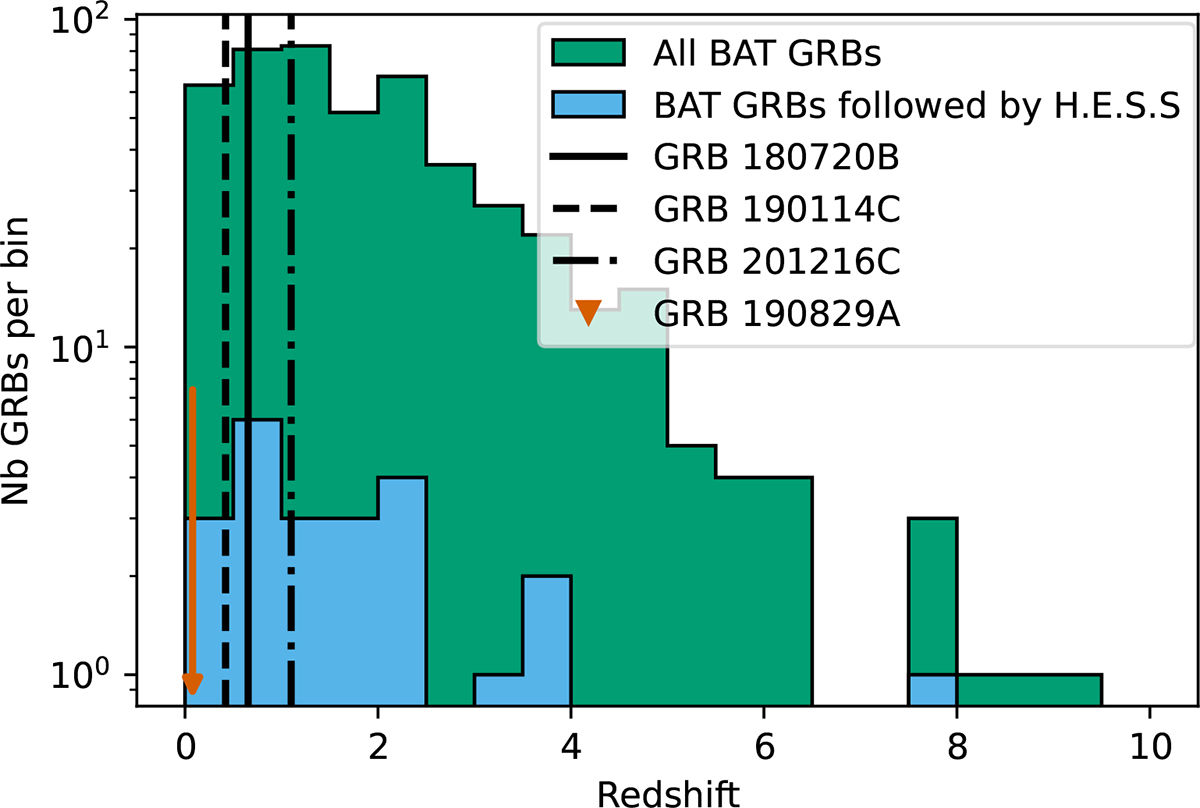
Distribution of the redshift measured for GRBs detected by Swift/BAT. The green colour represents the whole Swift/BAT population with redshift measurements. The redshift distribution of GRBs observed by H.E.S.S. is shown in blue. The black lines represent the individual measurements for all GRBs detected at VHE. The redshift value of GRB 190829A is represented with the orange arrow.
Current usage metrics show cumulative count of Article Views (full-text article views including HTML views, PDF and ePub downloads, according to the available data) and Abstracts Views on Vision4Press platform.
Data correspond to usage on the plateform after 2015. The current usage metrics is available 48-96 hours after online publication and is updated daily on week days.
Initial download of the metrics may take a while.