Fig. 12.
Download original image
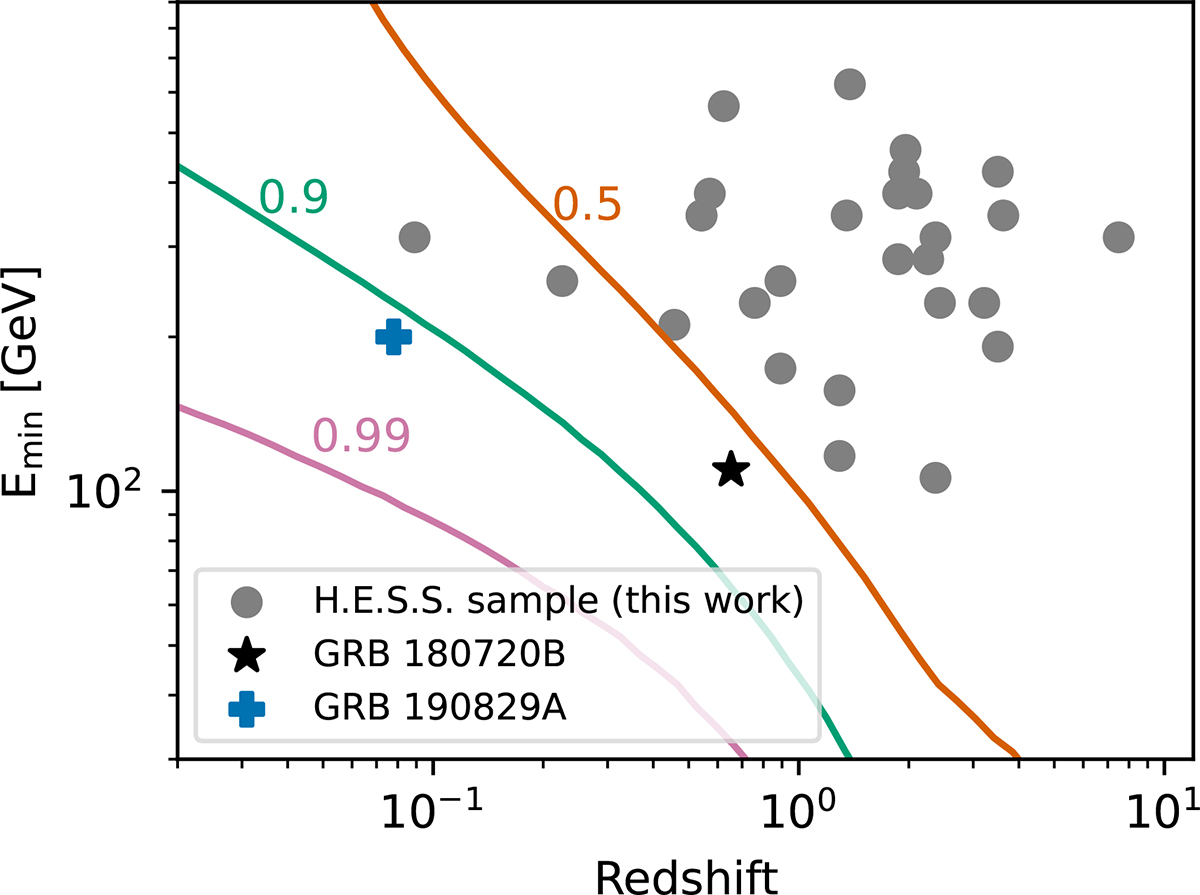
Energy threshold and redshift for the H.E.S.S. sample analysed in this work, shown as grey points. The curves indicate the energy at which, at a given redshift, the EBL absorption coefficient reaches a value of 0.99 (pink curve), 0.9 (turquoise curve), and 0.5 (orange curve). The two VHE-detected GRBs by H.E.S.S. are indicated with a star (GRB 180720B) and blue cross (GRB 190829A).
Current usage metrics show cumulative count of Article Views (full-text article views including HTML views, PDF and ePub downloads, according to the available data) and Abstracts Views on Vision4Press platform.
Data correspond to usage on the plateform after 2015. The current usage metrics is available 48-96 hours after online publication and is updated daily on week days.
Initial download of the metrics may take a while.