Open Access
Fig. 2.
Download original image
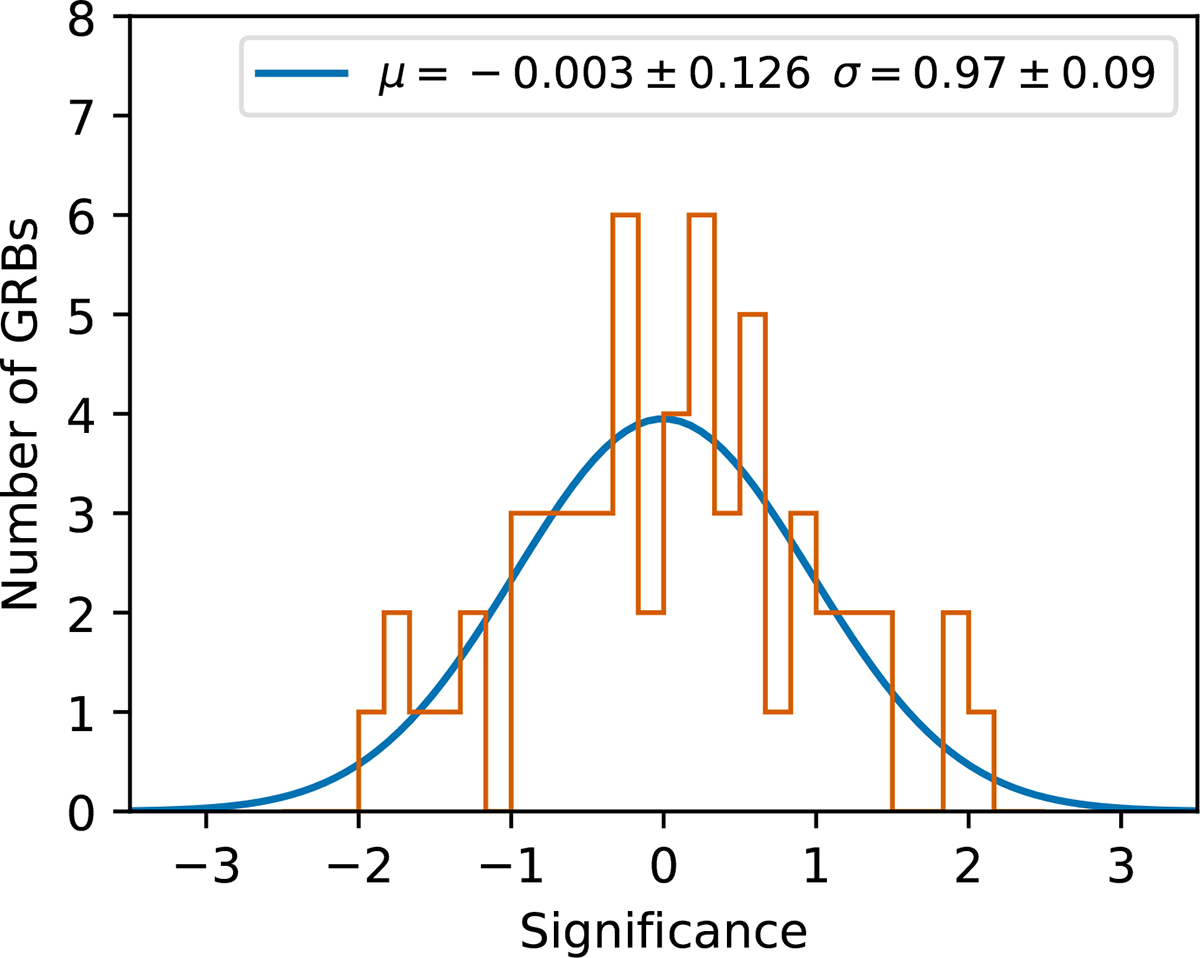
Significance distribution of the gamma-ray emission for the loc follow-ups. The distribution is shown in orange, and the fitted Gaussian is shown in blue. Each entry of the histogram corresponds to one GRB or cluster (see text for details).
Current usage metrics show cumulative count of Article Views (full-text article views including HTML views, PDF and ePub downloads, according to the available data) and Abstracts Views on Vision4Press platform.
Data correspond to usage on the plateform after 2015. The current usage metrics is available 48-96 hours after online publication and is updated daily on week days.
Initial download of the metrics may take a while.