Open Access
Fig. 3.
Download original image
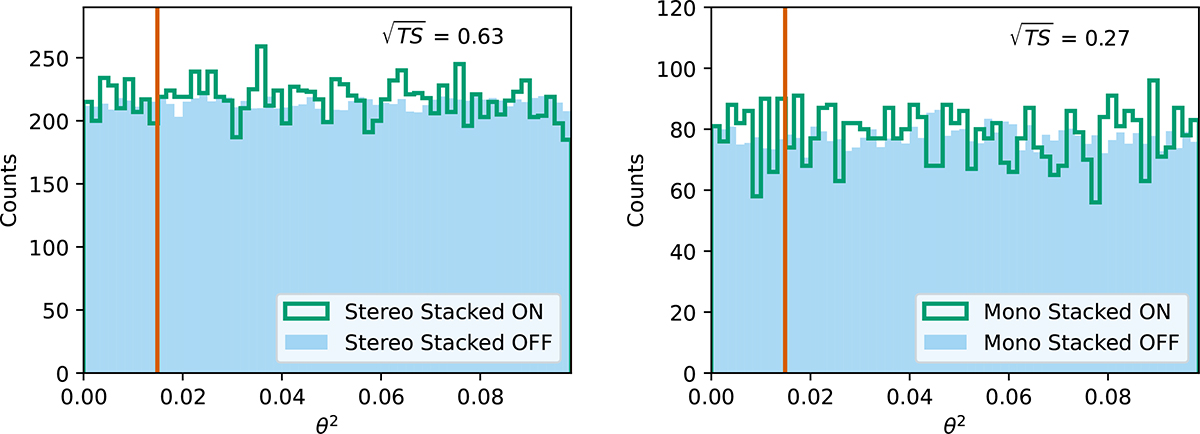
Stacked analysis of the GRB sample. The θ2 plots of stacked H.E.S.S. ON and OFF events are shown in green and shaded blue, respectively, for the stereo (left panel) and mono (right panel) observations. The orange vertical line corresponds to the θ2 cut as explained in Sect. 5.
Current usage metrics show cumulative count of Article Views (full-text article views including HTML views, PDF and ePub downloads, according to the available data) and Abstracts Views on Vision4Press platform.
Data correspond to usage on the plateform after 2015. The current usage metrics is available 48-96 hours after online publication and is updated daily on week days.
Initial download of the metrics may take a while.