Fig. 6.
Download original image
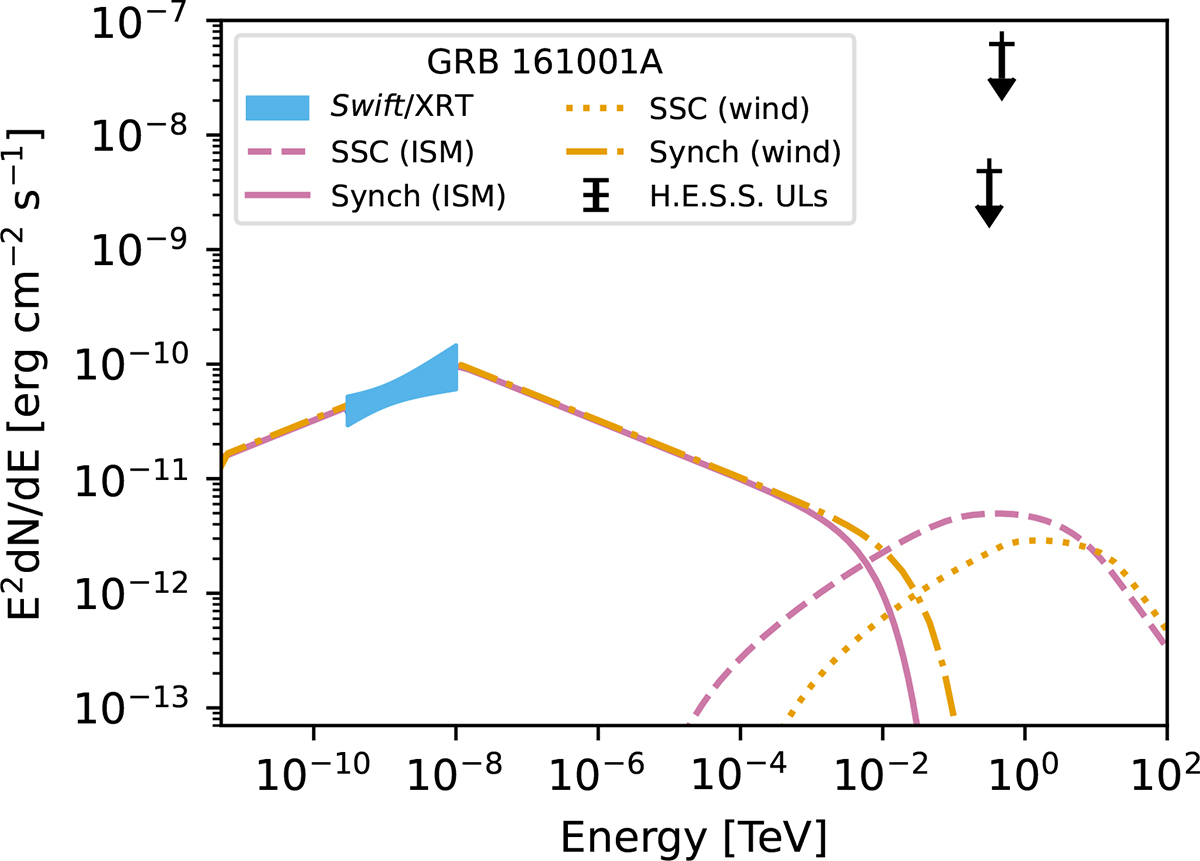
SED of GRB 161001A. The Swift/XRT spectrum is shown with the blue butterfly. The H.E.S.S. ULs are shown in black. For the modelled emission, synchrotron is depicted by a pink solid line in the ISM case and a yellow dashed-dotted line in the wind case. The SSC component is shown as a pink dashed line for ISM and a yellow dotted line for wind.
Current usage metrics show cumulative count of Article Views (full-text article views including HTML views, PDF and ePub downloads, according to the available data) and Abstracts Views on Vision4Press platform.
Data correspond to usage on the plateform after 2015. The current usage metrics is available 48-96 hours after online publication and is updated daily on week days.
Initial download of the metrics may take a while.