Fig. 14.
Download original image
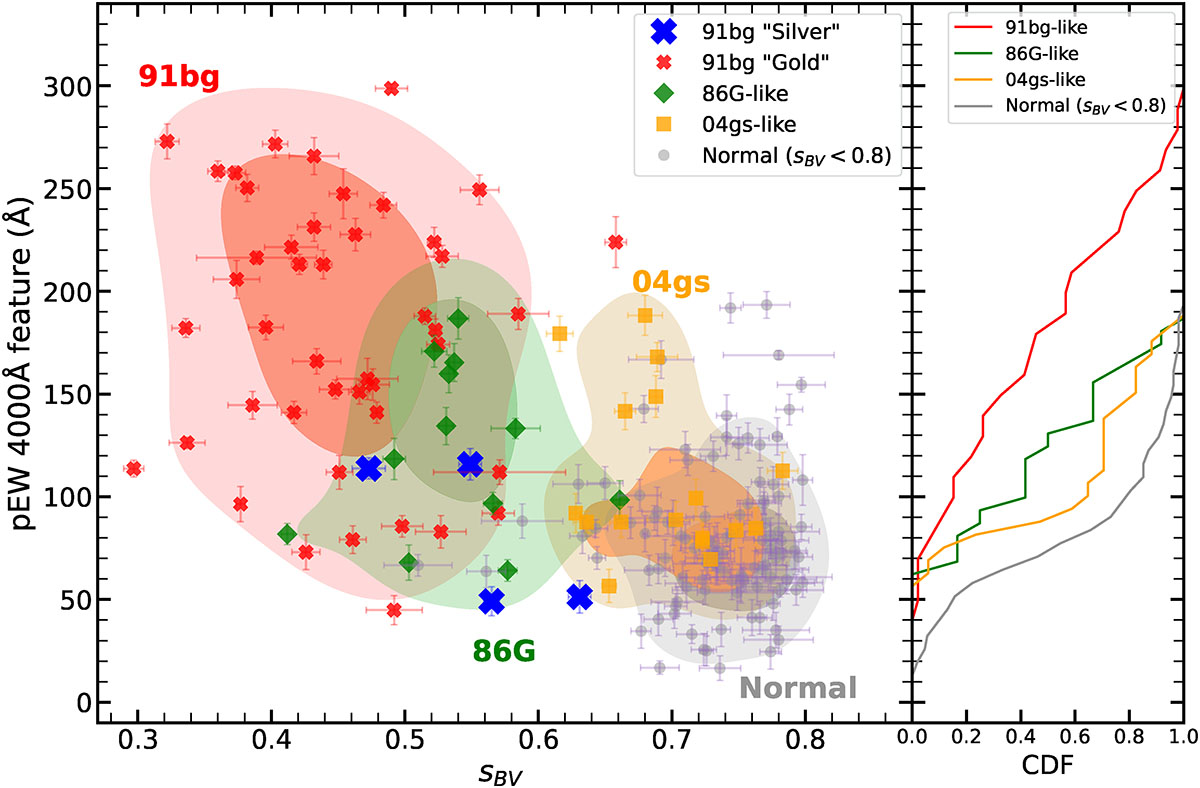
pEW diagram of Ti IIλ4000 plotted against the color stretch parameter sBV showing the three subtypes 91bg-like (red), 86G-like (green), and 04gs-like (orange) from our subluminous sample, along with normal SNe Ia with sBV < 0.8 (grey) as distinguished different SNIa populations based on their spectral characteristics and color evolution. The shaded regions around each subtype indicate the confidence levels (1σ and 2σ ) of their distributions in the pEW–sBV plane. Additionally, the 4 91bg-like SNe Ia labeled as silver candidates in (blue) are plotted and re-classified with respect to their distance to maximum of the KDE distributions of the three SN Ia populations (91bg-like, 86G-like, and 04gs-like). The cumulative distributions for all different SN Ia populations are shown in the right panel.
Current usage metrics show cumulative count of Article Views (full-text article views including HTML views, PDF and ePub downloads, according to the available data) and Abstracts Views on Vision4Press platform.
Data correspond to usage on the plateform after 2015. The current usage metrics is available 48-96 hours after online publication and is updated daily on week days.
Initial download of the metrics may take a while.