Fig. 3.
Download original image
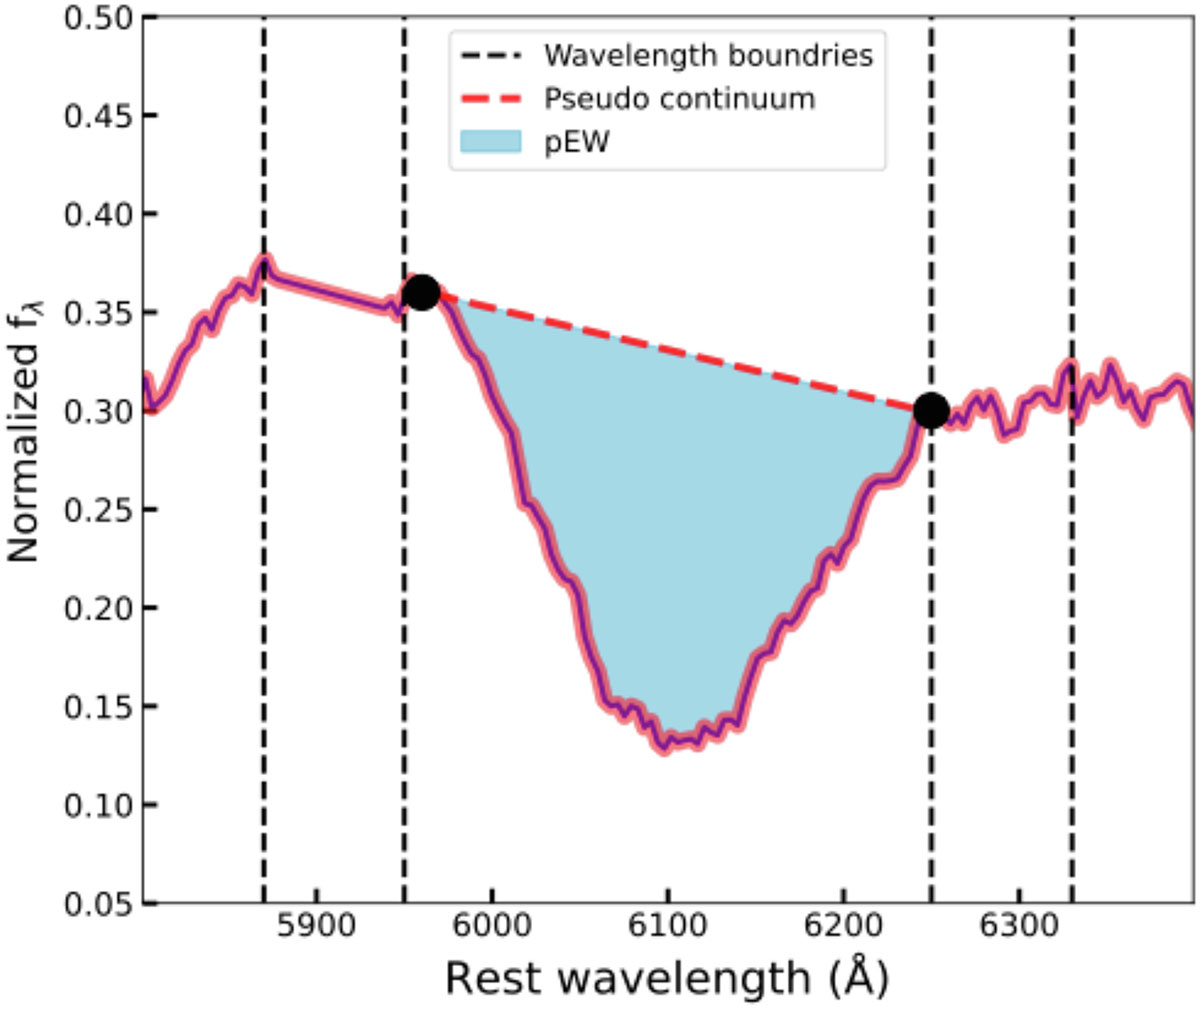
Demonstration of a measurement of a pseudo-equivalent width (pEW) for the Si IIλ6355 feature with Spextractor. The rest-frame spectrum with its uncertainty is shown in red. The vertical dashed black lines determine the wavelength boundaries of the feature. A dashed red line represents the pseudo-continuum connecting both sides of the spectral feature and the shaded blue area is the integral between the pseudo continuum and the binned spectrum within the defined wavelength boundaries, which defines the pEW.
Current usage metrics show cumulative count of Article Views (full-text article views including HTML views, PDF and ePub downloads, according to the available data) and Abstracts Views on Vision4Press platform.
Data correspond to usage on the plateform after 2015. The current usage metrics is available 48-96 hours after online publication and is updated daily on week days.
Initial download of the metrics may take a while.