Open Access
Fig. 5.
Download original image
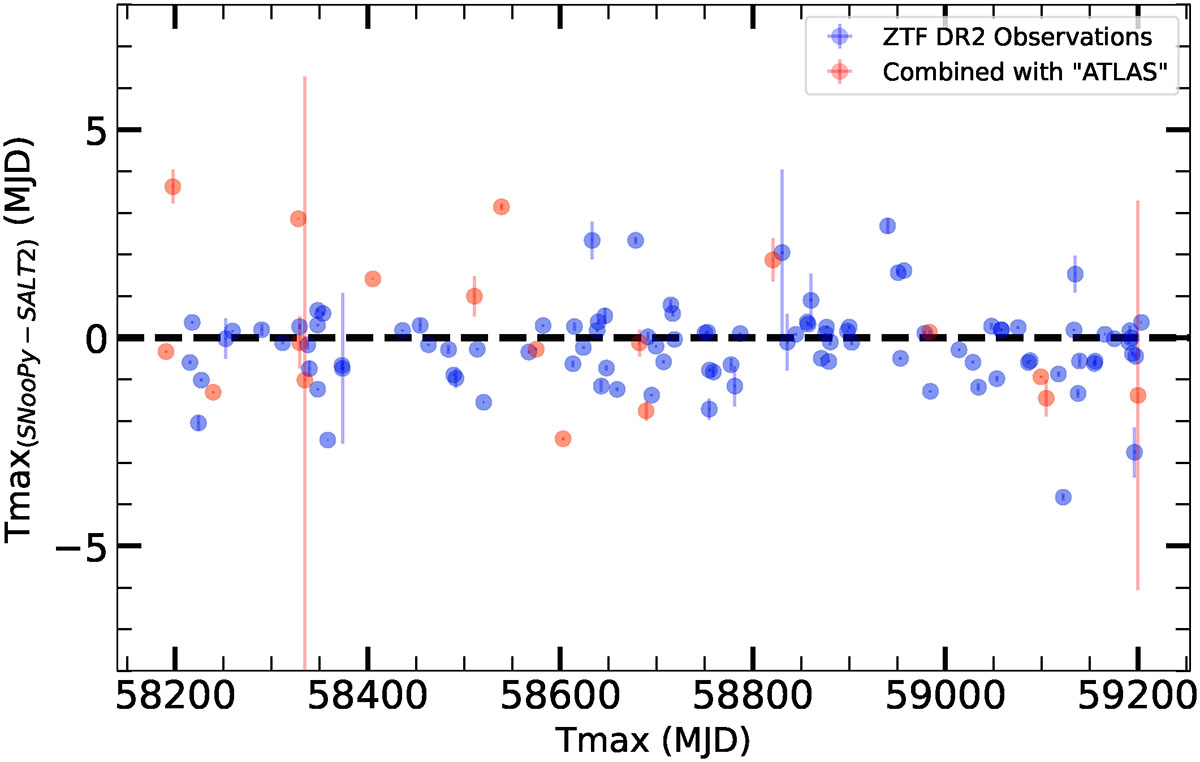
SN time of maximum light residuals comparison between SNooPy and SALT2 light-curve models. Blue points indicate differences of time of maxima when fitted to ZTF data only, and red dots indicate differences when ATLAS data is included in the SNooPy fits only.
Current usage metrics show cumulative count of Article Views (full-text article views including HTML views, PDF and ePub downloads, according to the available data) and Abstracts Views on Vision4Press platform.
Data correspond to usage on the plateform after 2015. The current usage metrics is available 48-96 hours after online publication and is updated daily on week days.
Initial download of the metrics may take a while.