Fig. 6.
Download original image
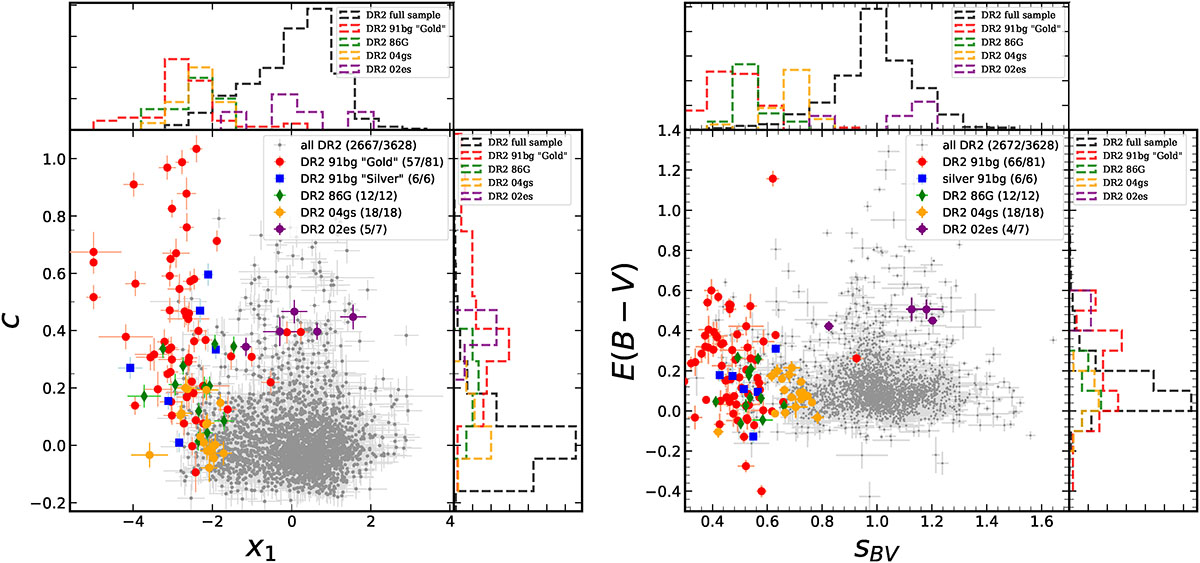
Left: SALT2 x1 vs. c diagram, along with the distributions of these parameters, is shown for all normal SNe Ia in ZTF DR2 and the subluminous groups: 91bg-like gold, 91bg-like silver, 86G-like, 04gs-like, and 02es-like. The numbers in the legend represent only the successfully fitted light curves from SALT2. Right: Similarly, the SNooPy sBV vs. E(B − V) diagram, along with the distributions of the parameters, for all normal SNe Ia in ZTF DR2 and the subluminous groups. The numbers in the legend represent the successful light-curve fits from SNooPy.
Current usage metrics show cumulative count of Article Views (full-text article views including HTML views, PDF and ePub downloads, according to the available data) and Abstracts Views on Vision4Press platform.
Data correspond to usage on the plateform after 2015. The current usage metrics is available 48-96 hours after online publication and is updated daily on week days.
Initial download of the metrics may take a while.