Fig. 7.
Download original image
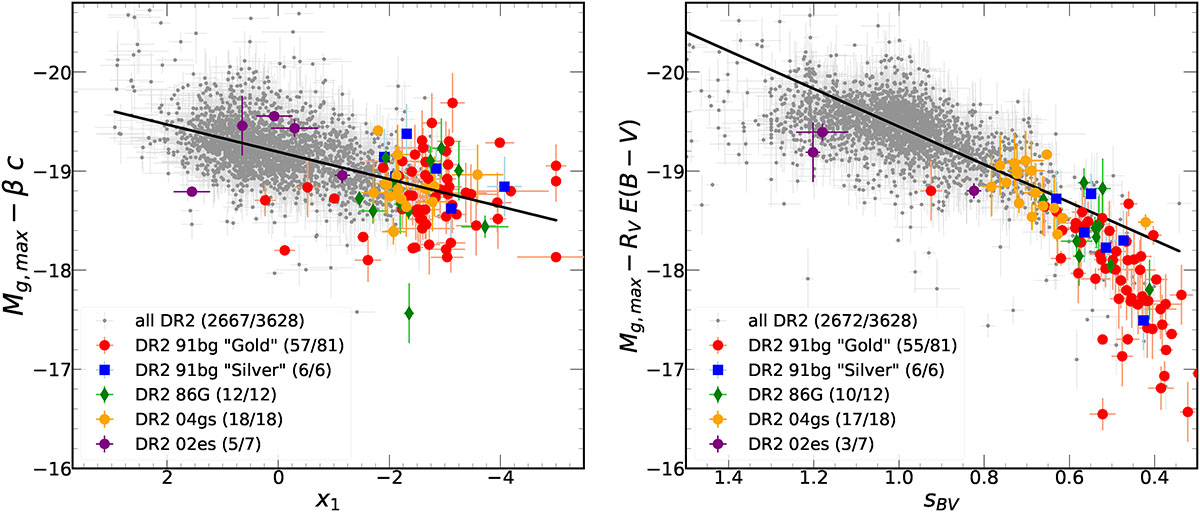
Absolute peak magnitudes in the g-band of our subluminous sample (in different colors) and the full ZTF DR2 in the background (in grey) plotted against the SALT2 stretch parameter x1 (left Panel) and the color stretch sBV (right Panel). These magnitudes are corrected for host galaxy extinction in terms of RVE(B − V) and from intrinsic color differences in terms of βc, where RV = 2.31 and β = 3.31. The black lines represent the first-order polynomial best fits to the normal SNe Ia for (0.4 < sBV < 1.4) and (−5 < x1 < 3). The numbers shown in the legends represent the numbers of good fits obtained from the subluminous and DR2 full sample.
Current usage metrics show cumulative count of Article Views (full-text article views including HTML views, PDF and ePub downloads, according to the available data) and Abstracts Views on Vision4Press platform.
Data correspond to usage on the plateform after 2015. The current usage metrics is available 48-96 hours after online publication and is updated daily on week days.
Initial download of the metrics may take a while.