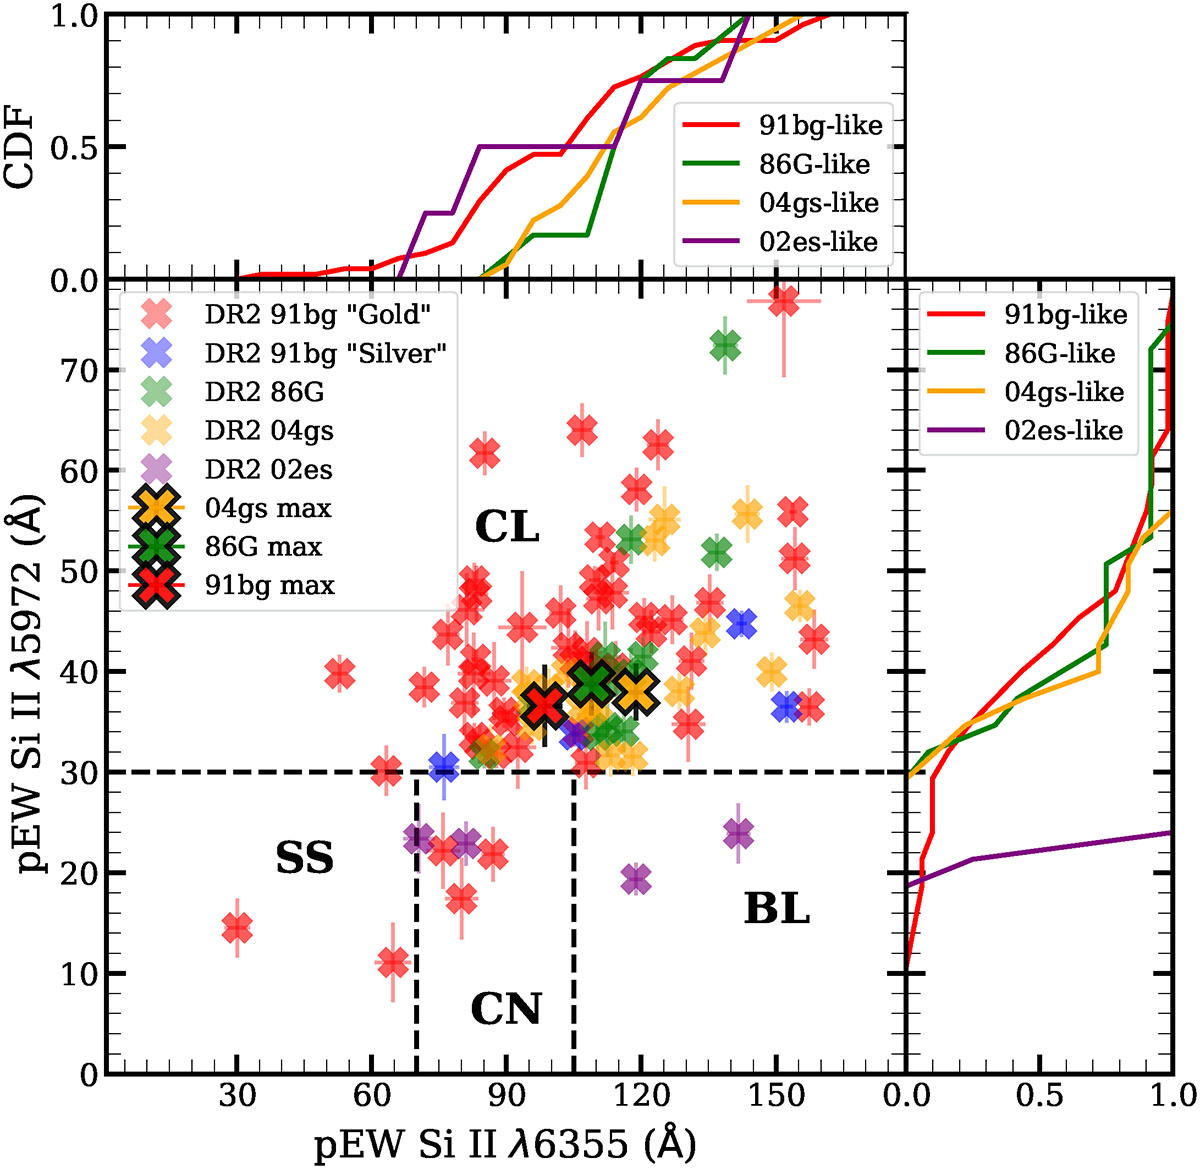
Fig. 8.
Download original image
Branch classification diagram plotted as the pEW of Si IIλ6355 against the pEW of Si IIλ5792 for the subtypes of our subluminous SNe Ia (91bg-like, 86G-like, 04gs-like, and 02es-like) with spectra between −5 and +5 days with respect to maximum light, showing the spectral classification into four subclasses on the diagram: core normal (CN), shallow silicon (SS), broad line (BL), and cool (CL). Additionally, the calculated spectral averages for the three subtypes (91bg-like, 86G-like, and 04gs-like) at the epoch of maximum light (−2 < d < +2) are plotted on the branch diagram and the distributions of the pEWs for all subtypes are as shown in the legend.
Current usage metrics show cumulative count of Article Views (full-text article views including HTML views, PDF and ePub downloads, according to the available data) and Abstracts Views on Vision4Press platform.
Data correspond to usage on the plateform after 2015. The current usage metrics is available 48-96 hours after online publication and is updated daily on week days.
Initial download of the metrics may take a while.