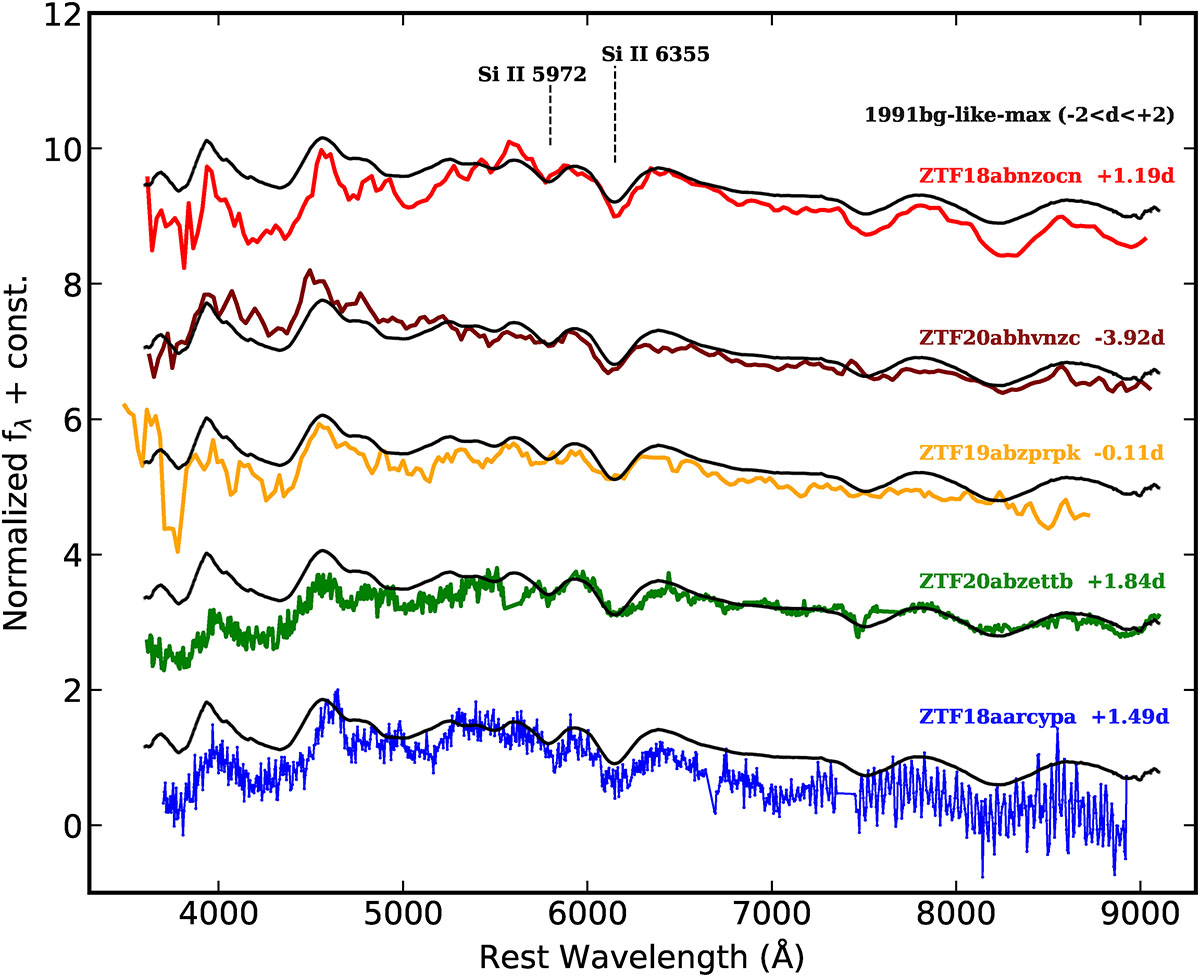
Fig. 9.
Download original image
Spectral average of the 91bg-like SN Ia (black) at epoch of maximum light (−2 < d < +2) compared to the spectra of the five 91bg-like SNe Ia identified on the Branch diagram (see, Fig. 8) in the lower regions with low pEW values, where the two Si IIλ5972 and λ6355 spectral features of these spectra are clearly affected by host galaxy contamination and/or low spectral resolution from the instrument causing inaccurate measurements of these absorption lines.
Current usage metrics show cumulative count of Article Views (full-text article views including HTML views, PDF and ePub downloads, according to the available data) and Abstracts Views on Vision4Press platform.
Data correspond to usage on the plateform after 2015. The current usage metrics is available 48-96 hours after online publication and is updated daily on week days.
Initial download of the metrics may take a while.