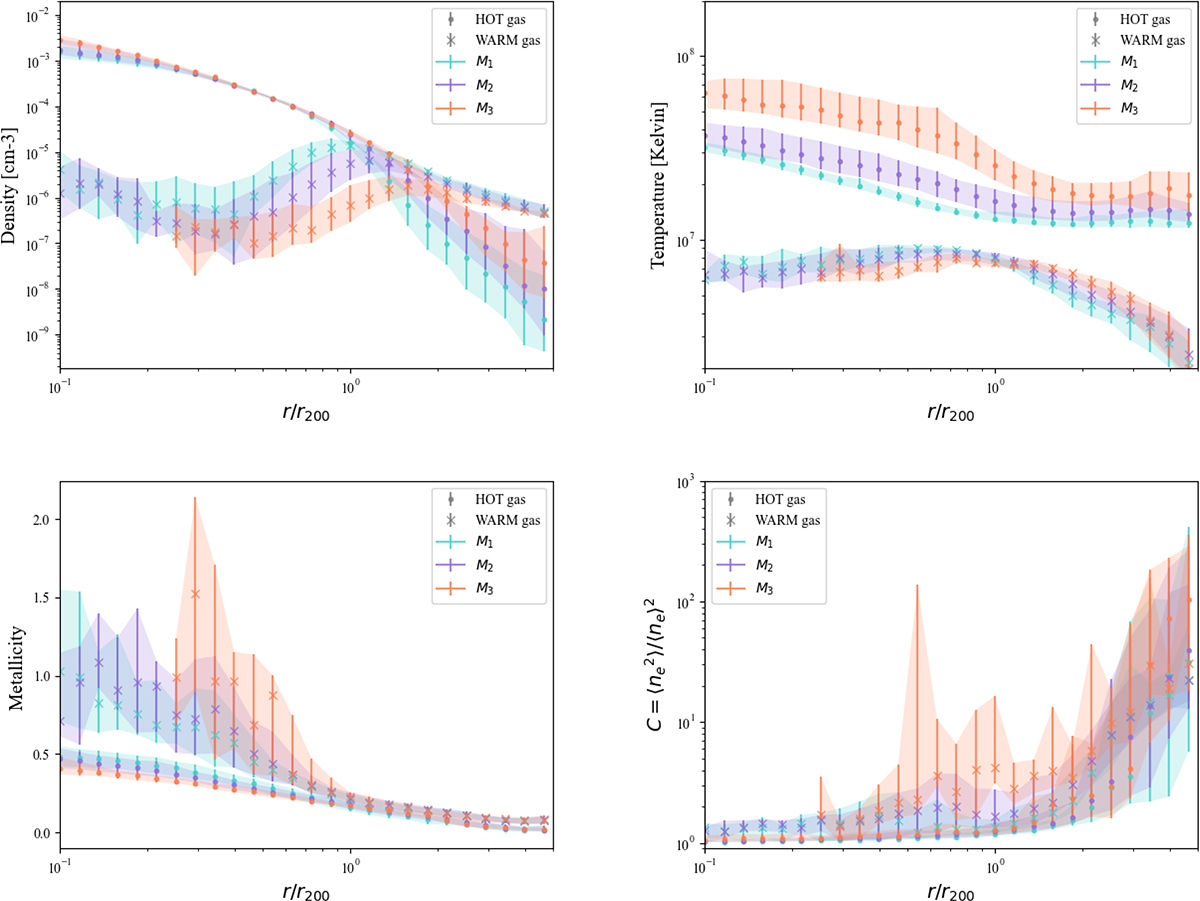
Fig. 1.
Download original image
Median radial profile of the gas properties for the two main gas phases (HOT and WARM gas, as defined in Table 1) as a function of the mass bins M1, M2, and M3, plotted in blue, purple, and orange, respectively (as defined in Table 2). The error bars are the percentiles from 20% to 80%. The average density (top left), temperature (top right), metal abundance (bottom left), and clumpiness (bottom right) profiles are illustrated in the different panels.
Current usage metrics show cumulative count of Article Views (full-text article views including HTML views, PDF and ePub downloads, according to the available data) and Abstracts Views on Vision4Press platform.
Data correspond to usage on the plateform after 2015. The current usage metrics is available 48-96 hours after online publication and is updated daily on week days.
Initial download of the metrics may take a while.