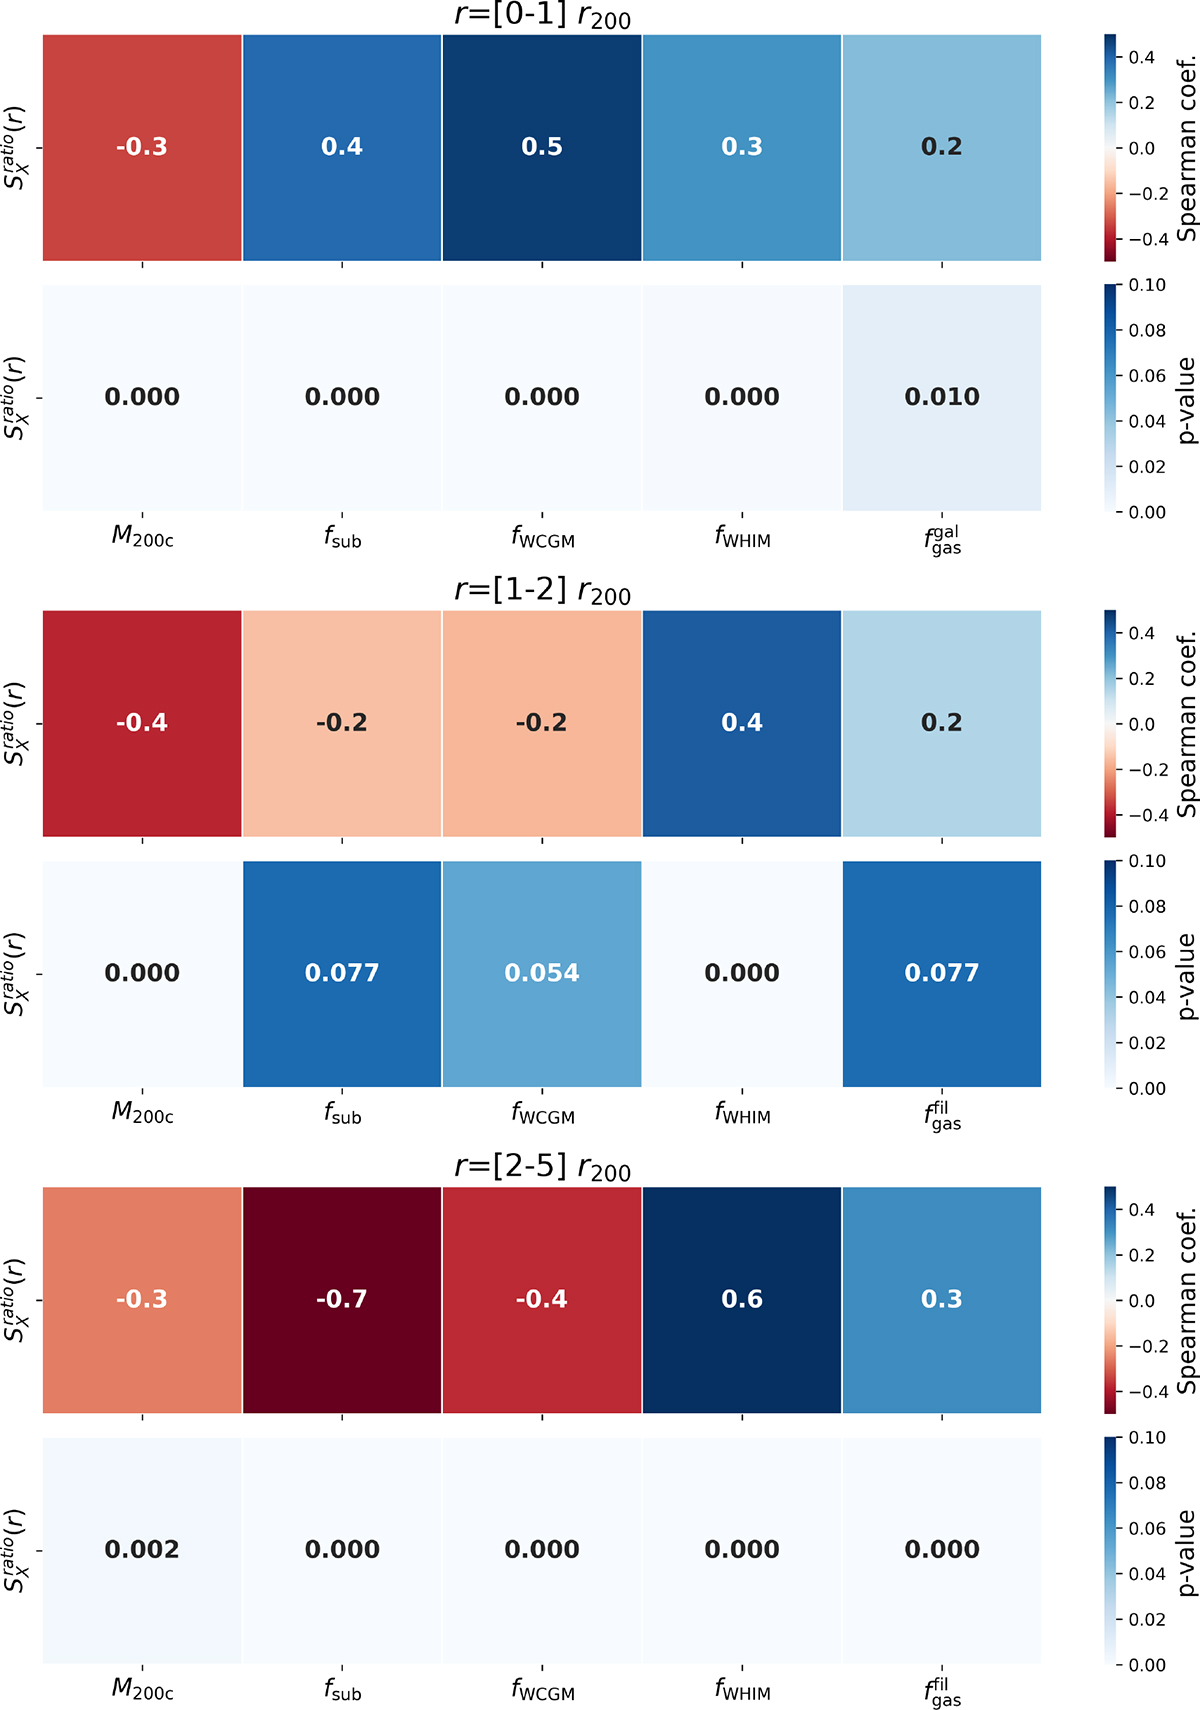
Fig. 10.
Download original image
Spearman correlation coefficient between the soft excess and the cluster gas properties and its associated p values, integrated over three radial ranges: inside clusters 0 > R[r200]> 1, around clusters 1 > R[r200]> 2, and outside clusters 2 > R[r200]> 5. As in Fig 9, except for the cluster mass (M200), we show the partial Spearman correlation to remove any mass dependence.
Current usage metrics show cumulative count of Article Views (full-text article views including HTML views, PDF and ePub downloads, according to the available data) and Abstracts Views on Vision4Press platform.
Data correspond to usage on the plateform after 2015. The current usage metrics is available 48-96 hours after online publication and is updated daily on week days.
Initial download of the metrics may take a while.