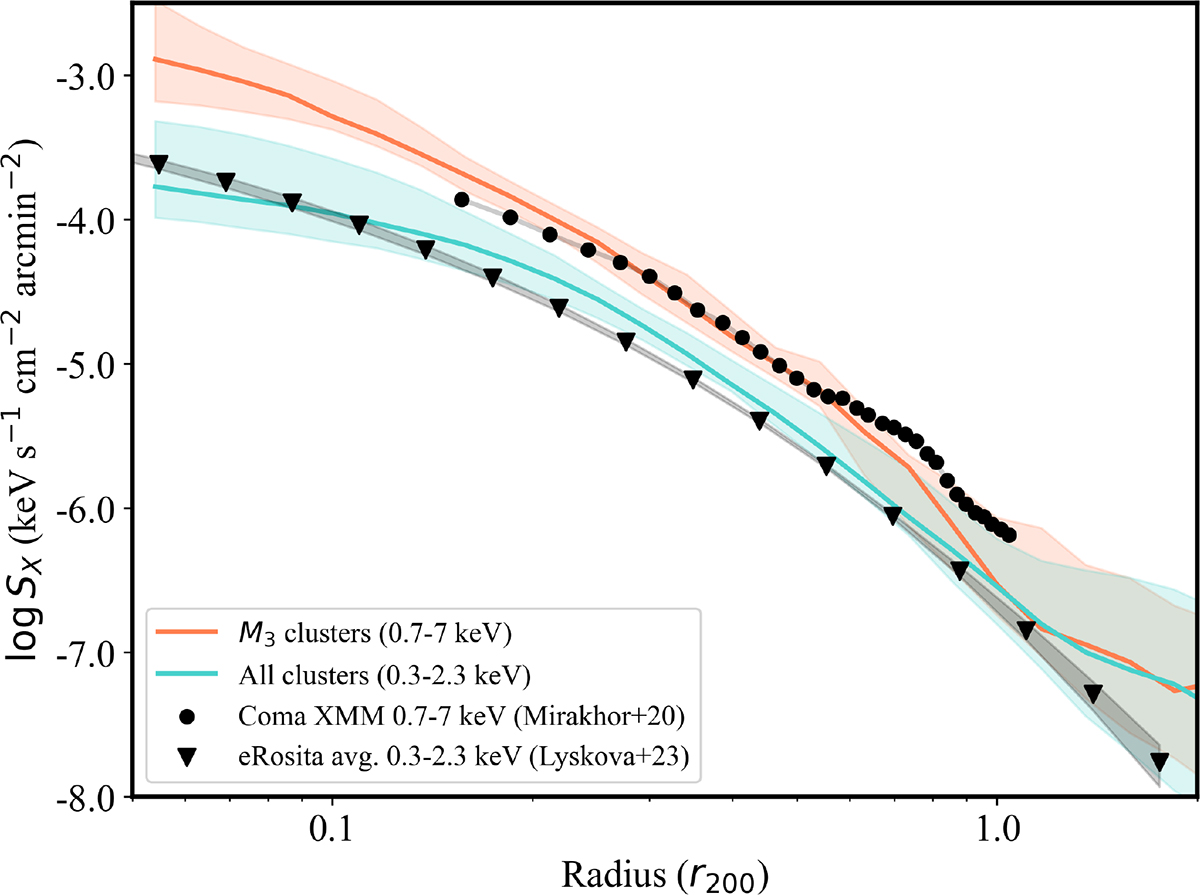
Fig. 4.
Download original image
Median X–ray surface brightness profiles from M1 and M3 clusters in the main–band X–ray ranges. The 0.3–2.3 keV range to match the best–fit model of the eRosita observations by Lyskova et al. (2023) is shown in green, and the band of 0.7–7 keV to match the observations of Coma (Mirakhor & Walker 2020) is shown as a blue curve. The error bars in the simulated profiles are the percentiles from 20% to 80%.
Current usage metrics show cumulative count of Article Views (full-text article views including HTML views, PDF and ePub downloads, according to the available data) and Abstracts Views on Vision4Press platform.
Data correspond to usage on the plateform after 2015. The current usage metrics is available 48-96 hours after online publication and is updated daily on week days.
Initial download of the metrics may take a while.