Fig. 5.
Download original image
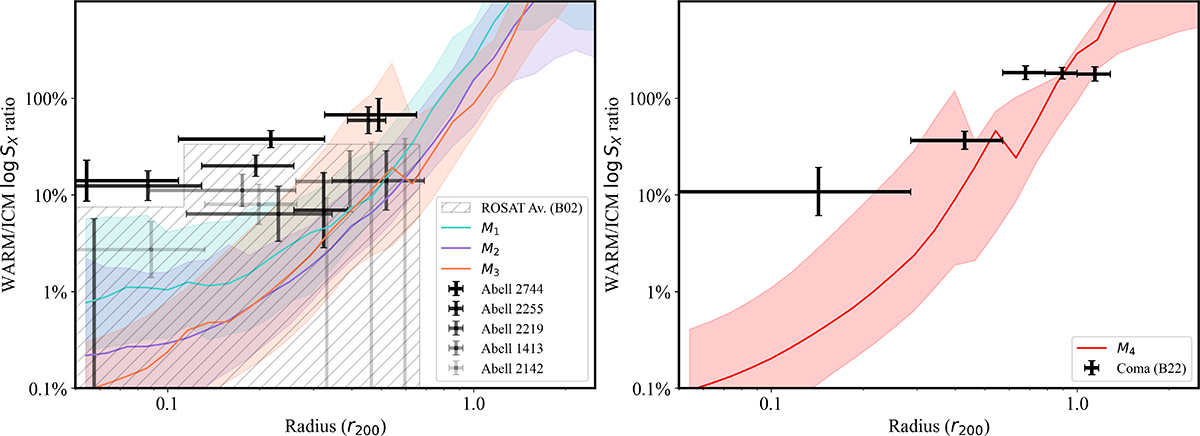
Left panel: Median WARM–to–ICM surface brightness ratio in the 0.2–0.4 keV band for the three cluster mass bins and the ROSAT results of Bonamente et al. (2002) for a sample of 38 clusters. Right panel: Median WARM–to–ICM surface brightness ratio in the 0.2–1 keV band for clusters in the M4 mass bins and the observational results of the soft-X-ray excess from the Coma cluster (Bonamente et al. 2022). For each line, the shaded area represents the 20th to 80th percentiles of the soft excess within each cluster sample.
Current usage metrics show cumulative count of Article Views (full-text article views including HTML views, PDF and ePub downloads, according to the available data) and Abstracts Views on Vision4Press platform.
Data correspond to usage on the plateform after 2015. The current usage metrics is available 48-96 hours after online publication and is updated daily on week days.
Initial download of the metrics may take a while.