Fig. 1
Download original image
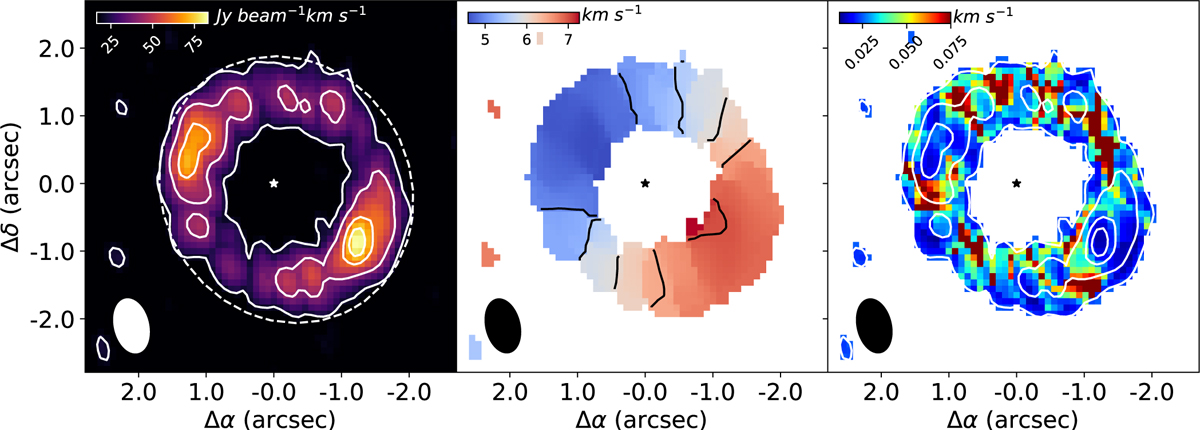
From left to right: zeroth-, first-, and second-moment map of CS 3–2 observed with NOEMA. The first- and second-moment maps were computed using a 3σ threshold to avoid noisy channels. Contours in the zeroth- and second-moment maps are shown for 0.25, 0.5, 0.75, and 0.9 of the integrated intensity map peak. The dashed white ellipse in the zeroth-moment map shows the area used to compute the integrated spectrum shown in Fig. 2.
Current usage metrics show cumulative count of Article Views (full-text article views including HTML views, PDF and ePub downloads, according to the available data) and Abstracts Views on Vision4Press platform.
Data correspond to usage on the plateform after 2015. The current usage metrics is available 48-96 hours after online publication and is updated daily on week days.
Initial download of the metrics may take a while.