Open Access
Fig. 5
Download original image
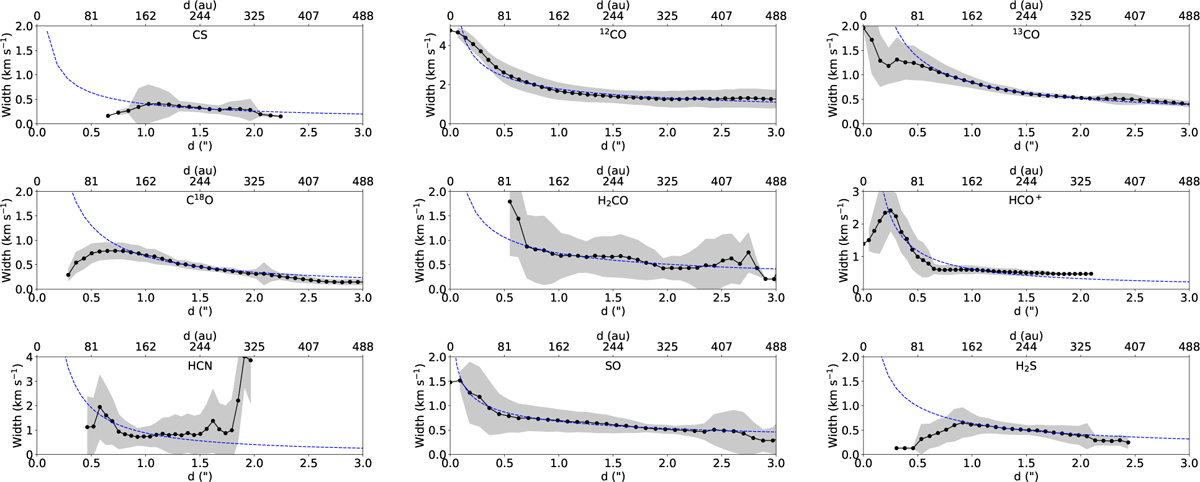
Radial profiles of the second-moment maps of the different species surveyed thus far. The dashed blue line shows a power law fit to the data. The name of each species is shown in each panel.
Current usage metrics show cumulative count of Article Views (full-text article views including HTML views, PDF and ePub downloads, according to the available data) and Abstracts Views on Vision4Press platform.
Data correspond to usage on the plateform after 2015. The current usage metrics is available 48-96 hours after online publication and is updated daily on week days.
Initial download of the metrics may take a while.