Open Access
Fig. 11
Download original image
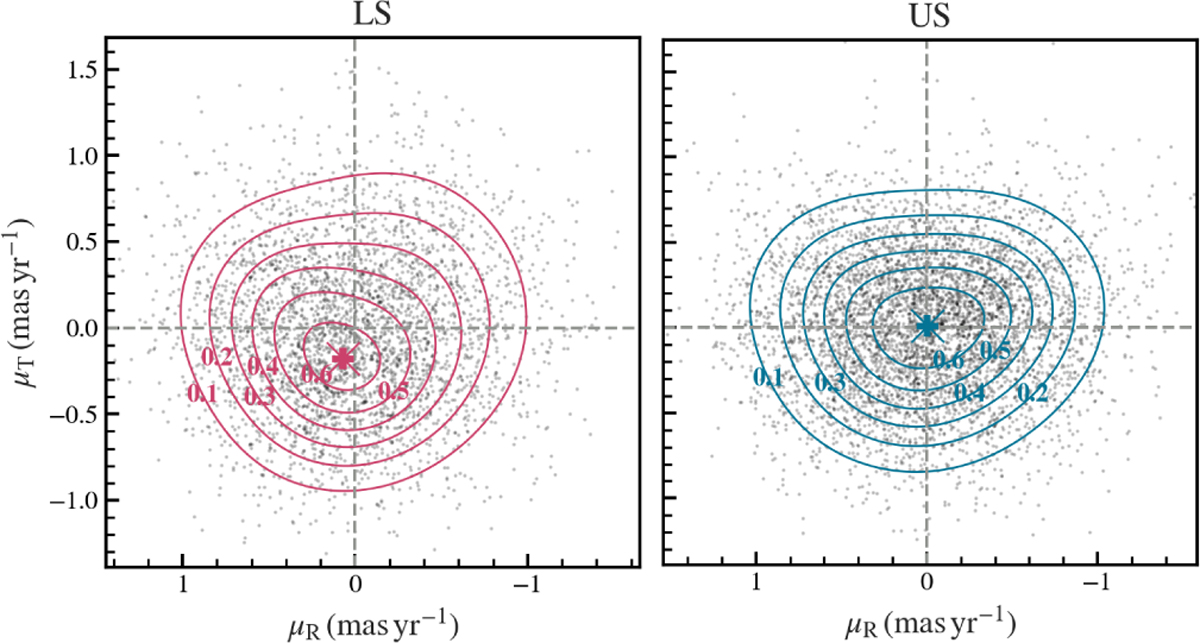
Tangential versus radial proper motions of LS (left panel) and US (right panel) stars. Contours indicate the probability density estimated by a Gaussian mixture model, highlighting the differences in statistical distributions and asymmetries between the two populations. The crosses indicate the centers of the distributions.
Current usage metrics show cumulative count of Article Views (full-text article views including HTML views, PDF and ePub downloads, according to the available data) and Abstracts Views on Vision4Press platform.
Data correspond to usage on the plateform after 2015. The current usage metrics is available 48-96 hours after online publication and is updated daily on week days.
Initial download of the metrics may take a while.