Fig. 5
Download original image
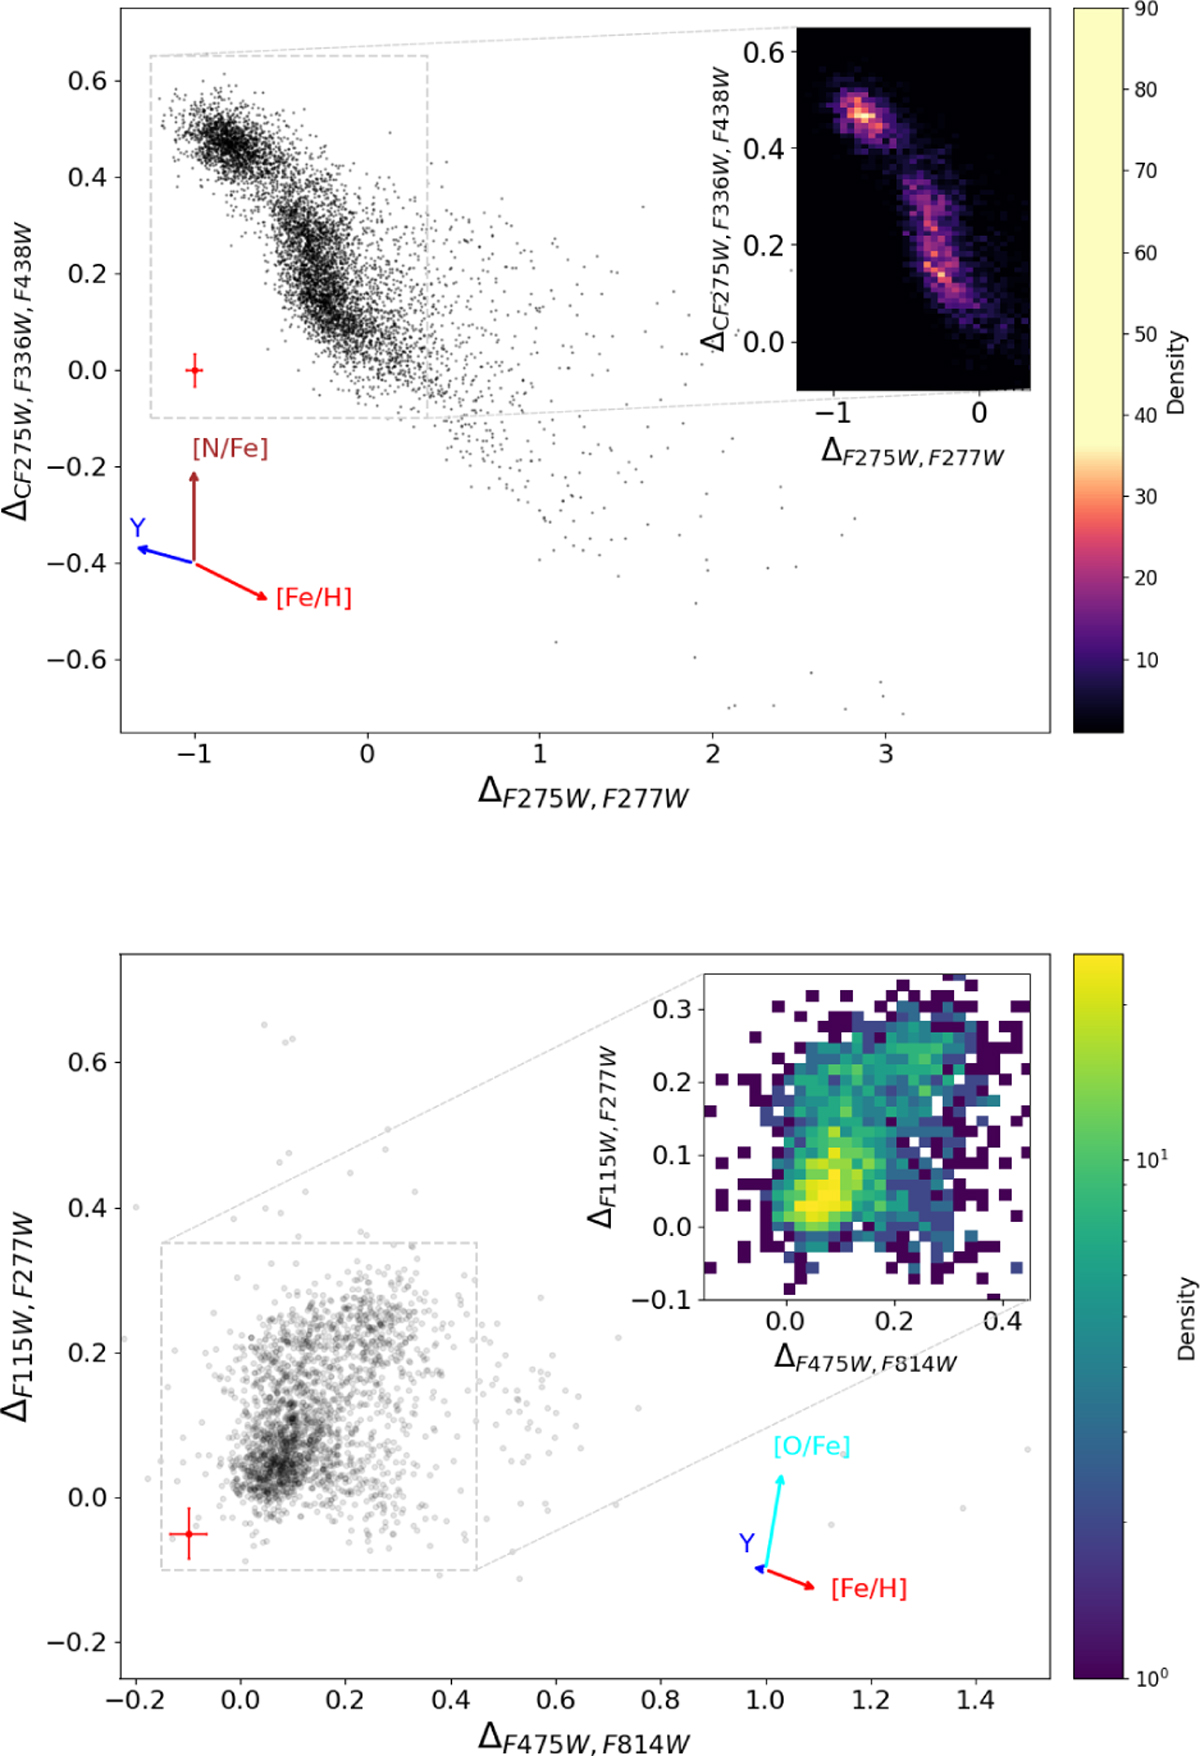
∆CF275W,F336W,F438W vs. ∆F275W,F277W ChM for bright MS stars (top) and ∆F115W,F277W vs. ∆F475W,F814W for M dwarfs (bottom). The insets show the corresponding Hess diagrams. The arrows show the effect of changing, one at time, the abundances of helium mass fraction Y, [N/Fe], [O/Fe], and [Fe/H] by 0.05, 1.2, −0.5, and 0.3 dex with respect to a reference stellar population with [Fe/H]=−1.7, [α/Fe]=0.4 and solar carbon and nitrogen contents (see Milone et al. 2018b; Marino et al. 2019, for details).
Current usage metrics show cumulative count of Article Views (full-text article views including HTML views, PDF and ePub downloads, according to the available data) and Abstracts Views on Vision4Press platform.
Data correspond to usage on the plateform after 2015. The current usage metrics is available 48-96 hours after online publication and is updated daily on week days.
Initial download of the metrics may take a while.