Fig. 6
Download original image
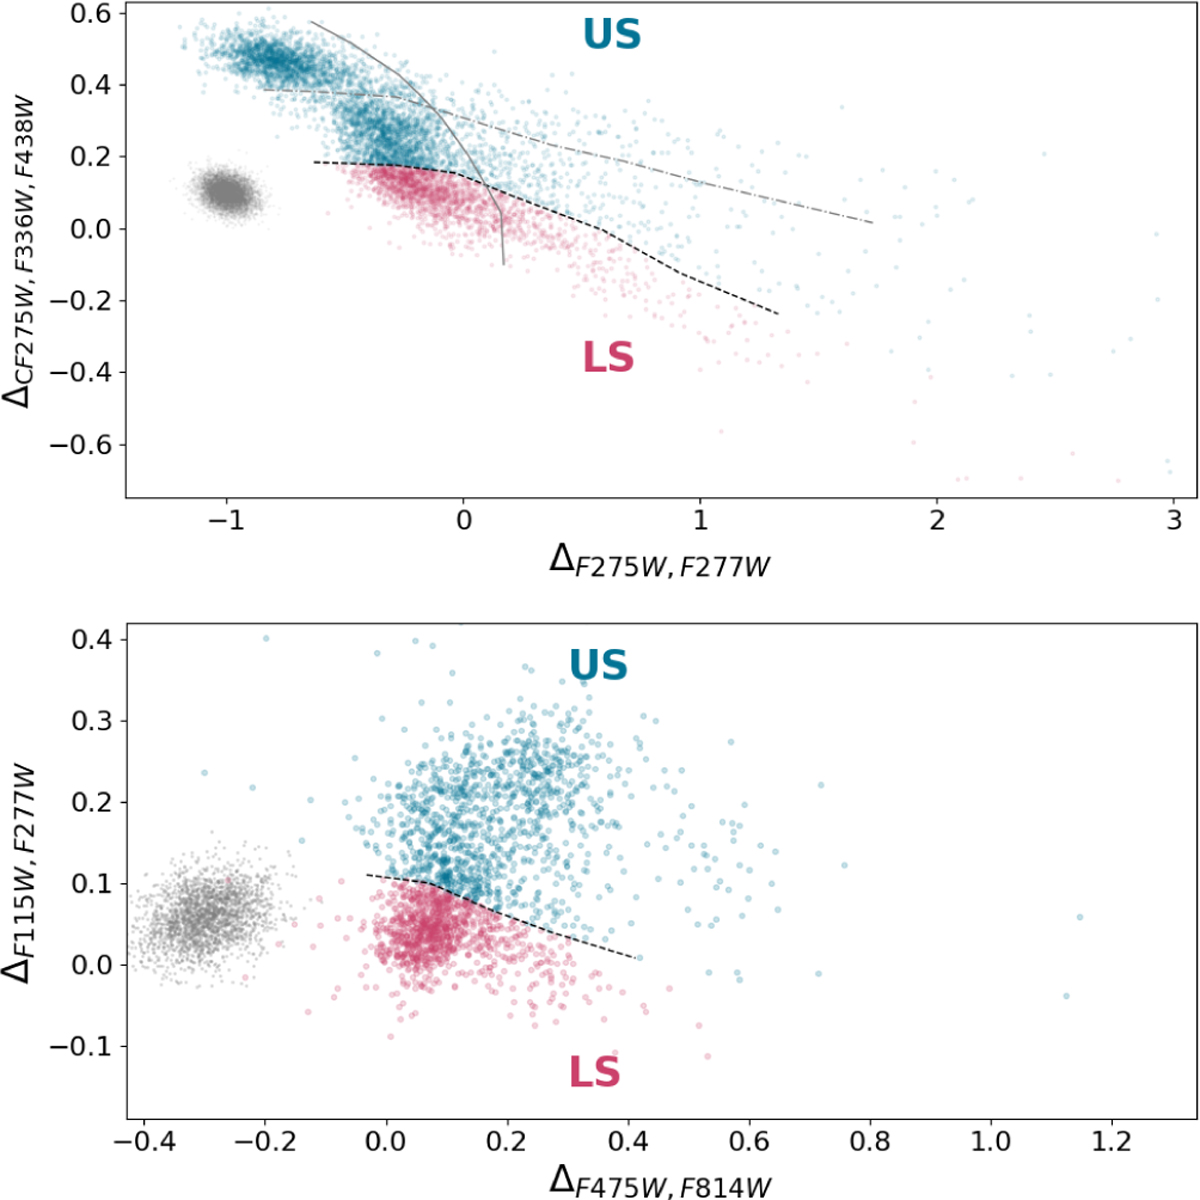
Reproduction of the ChMs from Figure 5, with bright MS stars (17.6 < mF277W < 18.6) in the top panel and M dwarfs (19.8 < mF277W < 21.7) in the bottom panel. LS and US stars are shown in red and blue, respectively. The black dashed line separates the selected US and LS populations. The dashed-dotted and solid gray lines mark the boundaries between the upper and middle streams, and between metal-rich and metal-poor stars, respectively. The gray dots represent the simulated ChMs for a simple stellar population, and are shifted to the left for clarity.
Current usage metrics show cumulative count of Article Views (full-text article views including HTML views, PDF and ePub downloads, according to the available data) and Abstracts Views on Vision4Press platform.
Data correspond to usage on the plateform after 2015. The current usage metrics is available 48-96 hours after online publication and is updated daily on week days.
Initial download of the metrics may take a while.